Category: NutriGraphAPI

  • Allergen Management for Restaurants: How Food Service Apps Handle Compliance with an API

    Allergen Management for Restaurants: How Food Service Apps Handle Compliance with an API

    A restaurant menu isn’t a document. It’s a promise. It’s a contract between the establishment and the guest, a declaration of what will be served. But in the modern world, that contract has a new, non-negotiable clause: safety.

    Consider this. A line cook, facing an empty container of the house brand soy sauce, reaches for a generic backup. The dish is made, the guest is served. No one thinks twice. But the new soy sauce contains wheat, whereas the house brand did not. Suddenly, your Pad Thai (Gluten-Free Option) is no longer gluten-free. The promise is broken. And your business is exposed to a level of legal and reputational liability that can cripple it.

    This isn’t a failure of the kitchen staff. It’s a failure of the system. Manual data entry, static spreadsheets, and relying on memory are relics of a bygone era. In a world of complex supply chains and stringent regulations, your biggest liability isn’t in the walk-in freezer; it’s in your database.

    This is not a tutorial about adding allergen icons to a PDF menu. This is a strategic guide for CTOs, POS developers, and the architects of modern food service platforms. We’re going to deconstruct the problem of programmatic allergen management and show you how to build a resilient, compliant, and ultimately superior system using an API-first approach. We’re moving beyond simple data lookup and into the realm of dynamic, real-time compliance. This is how you turn a liability into a competitive advantage.


    Why Allergen Management is a Legal Requirement for Restaurants

    Ignoring allergen management isn’t just bad service; it’s illegal. Governments worldwide have recognized the life-threatening severity of food allergies and have enacted legislation that places the burden of transparency squarely on food service operators. For any technology platform serving this industry, understanding these laws isn’t optional—it’s the cost of entry.
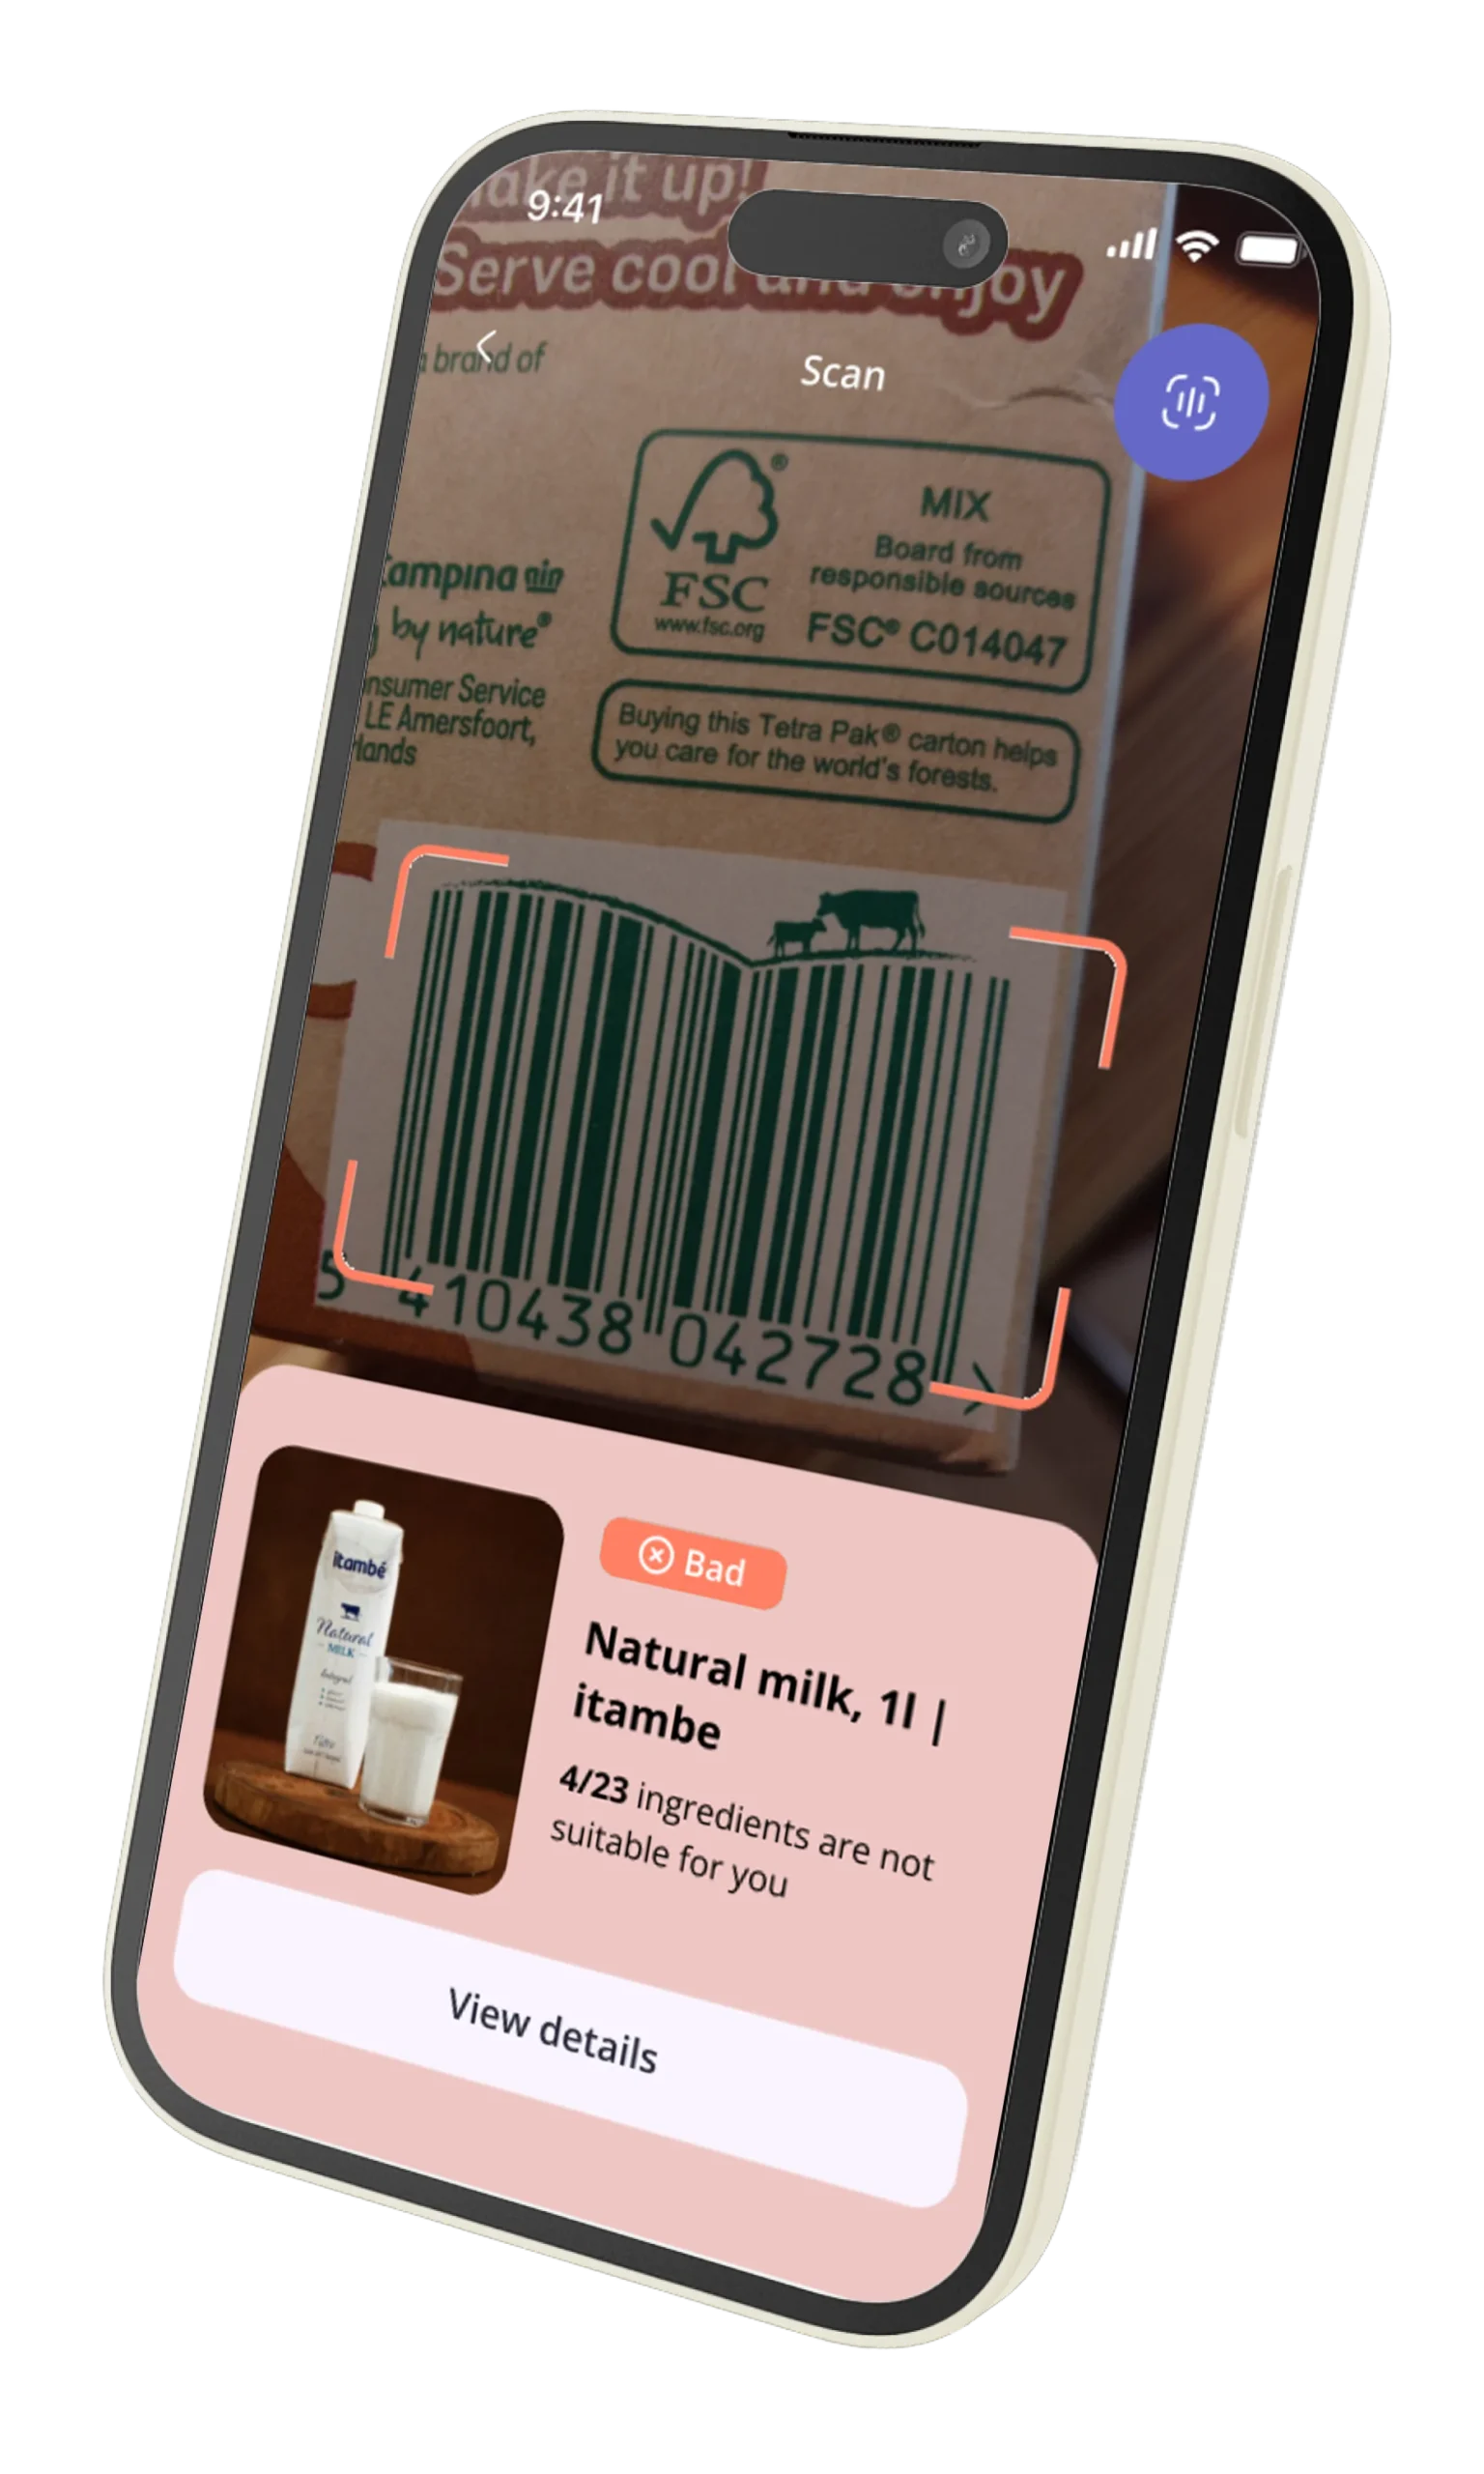
    Food Scan Genius App Scanner

    The UK’s Natasha’s Law

    Effective October 2021, the UK Food Information Amendment, known as Natasha’s Law, was a watershed moment. It mandates that all food pre-packaged for direct sale (PPDS)—think sandwiches, salads, and pastries made and packaged on-site—must have a full ingredient list with allergenic ingredients emphasized on the label. This was a direct response to a tragic, preventable death. For developers, this means your system must be able to generate precise, ingredient-level labels on demand, pulling from a database that reflects the exact components of that day’s production.

    EU Food Information to Consumers (FIC) Regulation No. 1169/2011

    Across the European Union, the FIC regulation has been the standard for years. It requires information for 14 major allergens to be clearly provided for non-prepackaged foods. This means a customer in a restaurant must be able to ask about the allergens in any dish, and the staff must have access to accurate, up-to-date information. A POS or kitchen display system that cannot provide this information instantly is a compliance failure waiting to happen.

    The US FDA and the Food Allergen Labeling and Consumer Protection Act (FALCPA)

    The United States, through the FDA, mandates the clear labeling of the top nine major food allergens (recently adding sesame). While FALCPA primarily targets packaged goods from manufacturers, the FDA’s Food Code, adopted by states, sets the standards for restaurants. The implicit requirement is that restaurants must be able to accurately disclose allergen information upon request to avoid misbranding their food. The rise in allergy-related lawsuits in the US demonstrates that the legal system is increasingly holding restaurants to this standard.

    For a technology leader, these regulations signal a fundamental shift. Allergen data is no longer metadata. It is core, mission-critical information with legal weight. Your software is not just managing menus; it’s managing public health and legal risk.

    ScanGeni Ventures Logo

    The Problem with Manual Allergen Data Entry

    The traditional approach to allergen management is a spreadsheet. A well-meaning manager sits down once a quarter, reviews the recipes, and updates a master document. This document is then, hopefully, referenced by staff. This system is fundamentally, catastrophically broken.

    • Human Error is Inevitable: A typo, a misremembered ingredient, a copy-paste error. In a spreadsheet with thousands of cells mapping ingredients to dishes, errors are not a risk; they are a certainty. When an error can lead to anaphylactic shock, certainty is unacceptable.

    • Update Lag Creates a Liability Gap: A chef tweaks a recipe, changing the brand of cooking wine. The supply chain manager substitutes a different brand of breadcrumbs. How long does it take for that change to propagate from the kitchen to the front-of-house staff’s reference sheet? A day? A week? In that gap, every order is a gamble. The “soy sauce substitution” problem isn’t a hypothetical; it’s a daily operational reality in every commercial kitchen.

    • The Staff Training Burden is Immense: You can’t expect every server to memorize the allergen profile of 75 different dishes, especially with high industry turnover. Relying on staff memory to bridge the gap in your data system is a recipe for disaster. Effective restaurant menu allergen software should empower staff, not burden them.

    • It Doesn’t Scale: This manual system collapses under the weight of complexity. It cannot handle menu customizations, seasonal changes, or multi-location operations where regional suppliers differ. It’s an artisanal solution for an industrial-scale problem.

    Manual entry is a system designed to fail. It treats allergen data as a static attribute to be recorded, when in reality, it is a dynamic, calculated property of a constantly changing system.

    How Modern Restaurant Tech Platforms Handle Allergen Compliance Programmatically

    The only way to solve a dynamic data problem is with a dynamic system. Modern food tech platforms—from enterprise POS systems to online ordering apps—are moving away from storing allergen information as a simple static field (has_nuts: true). Instead, they treat it as a computed property, derived in real-time from a granular, authoritative source of truth. This is the API-first approach.

    The architecture looks like this:

    1. Centralized, Granular Ingredient Database: The foundation is a comprehensive database of ingredients, not just at the generic level (“flour”) but at the supplier and product level (“King Arthur All-Purpose Flour, SKU #71012”). This is the only level of granularity that matters.
    2. Recipes as a Bill of Materials: A menu item is not a flat object. It’s a structured recipe—a bill of materials that lists specific ingredients and their quantities. A Cheeseburger contains a Brioche Bun, a Beef Patty, Cheddar Cheese, etc.
    3. The Allergen API as the Engine: Instead of storing the allergen profile on the Cheeseburger object, the system makes a call to an external, specialized service like NutriGraphAPI. It sends the list of ingredient SKUs, and the API returns a comprehensive, calculated allergen profile for the final dish.
    4. Real-Time Recalculation: When an ingredient is substituted—either temporarily in the kitchen or permanently in the recipe—the system simply updates the ingredient list for that dish. The next time the allergen profile is requested, the API call is made with the new ingredient set, and the result is instantly accurate. The “soy sauce substitution” problem is solved.

    This architecture decouples the menu management from the allergen compliance logic. It allows your platform to focus on its core competency while outsourcing the complex, high-stakes task of food data science and regulatory tracking to a specialized, reliable partner.

    What a Restaurant Allergen API Needs to Return

    Not all food APIs are created equal. A generic recipe API that tells you a brownie contains “flour” and “cocoa” is useless for professional compliance. To power a true restaurant menu allergen software solution, the API response must be built for the realities of a commercial kitchen. It needs to provide data at multiple levels of abstraction.

    Ingredient-Level Data

    For any given ingredient SKU, the API must return its fundamental truth.
    * Declared Allergens: The 14 EU / 9 US major allergens explicitly present in the ingredient’s formulation.
    * “May Contain” Statements (PAL): Crucial precautionary allergen labeling information from the manufacturer (e.g., “Processed in a facility that also handles peanuts”). This is critical for guests with severe allergies and is often overlooked by simpler APIs.
    * Full Ingredient Statement: The complete, legally required list of sub-ingredients.

    Dish-Level Data (Calculated)

    This is where the magic happens. The API takes an array of ingredient SKUs and quantities and computes the derived properties of the finished dish.
    * Aggregated Allergen Array: A clean, de-duplicated list of all declared allergens present in the final dish. If three ingredients contain dairy, the final dish should simply list "Dairy" once.
    * Aggregated “May Contain” Array: A de-duplicated list of all precautionary warnings from all constituent ingredients. This is a vital risk management tool.
    * Compliance Flags: Boolean flags for common dietary and lifestyle concerns (is_vegan, is_vegetarian, is_gluten_free) that are calculated based on the properties of every single ingredient.

    Cross-Contamination Arrays (The Enterprise Feature)

    This is what separates a basic tool from an enterprise-grade compliance engine. The API should allow you to model the kitchen environment itself.
    * Station-Level Risks: You should be able to tag a menu item with the station it’s prepared on (e.g., "fryer", "grill").
    * Environment-Informed API Response: The API can then append environmental cross-contamination risks to the response. For example, even if the French Fries themselves are gluten-free, if the fryer is also used for breaded chicken, the API should add a cross-contamination warning for "Gluten". This requires a more sophisticated integration but provides the highest level of accuracy.

    An API that only provides a top-line list of allergens for a generic recipe is a toy. A professional platform requires a data partner that understands the flow of food from the supplier to the plate.

    Building an Allergen-Aware Menu System: Data Model + API Integration Walkthrough

    Let’s make this concrete. To build this system, you need a robust data model within your application that can interact intelligently with an external allergen API. Here’s a simplified but effective schema.

    Step 1: The Local Data Model

    Your application’s database needs to model the relationship between menus, dishes, recipes, and ingredients. You aren’t storing the allergen data itself, but the components that will be sent to the API.

    Here’s what your core data models might look like in JSON format:

    MenuItem
    This represents the dish on the menu. The key is the recipe array, which references your internal Ingredient objects.

    {
      "menu_item_id": "dish-101",
      "name": "Classic Cheeseburger",
      "description": "A juicy beef patty with cheddar cheese on a brioche bun.",
      "price": 14.99,
      "recipe": [
        { "ingredient_id": "ing-001", "quantity": 1, "unit": "each" },
        { "ingredient_id": "ing-002", "quantity": 150, "unit": "g" },
        { "ingredient_id": "ing-003", "quantity": 25, "unit": "g" },
        { "ingredient_id": "ing-004", "quantity": 10, "unit": "g" }
      ]
    }
    

    Ingredient
    This object links your internal representation to a specific, real-world product using a supplier product code or UPC. This supplier_product_code is the golden key you’ll send to the API.

    {
      "ingredient_id": "ing-001",
      "name": "Brioche Bun",
      "supplier": "City Bakers Co.",
      "supplier_product_code": "CB-58812"
    }
    

    Step 2: The API Integration Flow

    When a user views the “Classic Cheeseburger” in your app, your backend doesn’t just fetch the MenuItem object. It executes the following logic:

    1. Fetch MenuItem: Get the object for dish-101 from your database.
    2. Gather Ingredient Keys: Iterate through the recipe array and collect all the supplier_product_code values from the corresponding Ingredient objects. You’ll have an array like ["CB-58812", "FP-90210", "VD-1138", "HK-4747"].
    3. Call the Allergen API: Make a POST request to the NutriGraphAPI endpoint, for example /v1/dish/calculate, with a payload containing these keys.

    API Request Body:

    {
      "ingredients": [
        { "product_code": "CB-58812", "quantity": 1, "unit": "each" },
        { "product_code": "FP-90210", "quantity": 150, "unit": "g" },
        { "product_code": "VD-1138", "quantity": 25, "unit": "g" },
        { "product_code": "HK-4747", "quantity": 10, "unit": "g" }
      ]
    }
    
    1. Receive and Cache the Response: NutriGraphAPI processes this list, looks up each product code in its massive, verified food data network, and returns a calculated profile for the entire dish.

    API Response Body:

    {
      "calculated_at": "2023-10-27T10:00:00Z",
      "allergens_declared": [
        "Wheat",
        "Milk",
        "Eggs",
        "Sesame"
      ],
      "allergens_may_contain": [
        "Soy",
        "Tree Nuts"
      ],
      "dietary_flags": {
        "is_vegan": false,
        "is_vegetarian": false,
        "is_gluten_free": false
      },
      "full_ingredient_statement": "BEEF PATTY (Beef, Salt, Pepper), BRIOCHE BUN (Enriched Wheat Flour, Water, Eggs, Butter (Milk), Sugar, Yeast, Salt, Sesame Seeds), CHEDDAR CHEESE (Pasteurized Milk, Cheese Cultures, Salt, Enzymes), KETCHUP (...)"
    }
    
    1. Merge and Display: Your backend then merges this API response with your local MenuItem data to render the complete, compliant view to the end-user.

    This model is resilient. If the bakery changes the bun recipe, NutriGraphAPI updates the data for CB-58812. Your application code doesn’t need to change. Your data is now correct, automatically.

    Handling Menu Customisations and Substitutions

    This is the final frontier and the hardest technical challenge: dynamic recalculation for customized orders. What happens when a customer says, “I’ll have the Classic Cheeseburger, but no cheese and on a gluten-free bun”?

    A static system collapses here. An API-driven system handles it with elegance.

    The process is identical to the one above, but it happens dynamically at the point of sale or order customization.

    1. Start with the Base Recipe: The POS or app starts with the base ingredient list for the Cheeseburger.
    2. Apply Modifications: As the user makes changes, your client-side logic modifies the ingredient array in real-time.
      • "Remove Cheese": The ingredient with product_code: "VD-1138" is removed from the array.
      • "Substitute GF Bun": The ingredient with product_code: "CB-58812" is replaced with the product_code for the gluten-free bun, e.g., "GFB-001".
    3. Recalculate on Demand: Your application makes a new API call to /v1/dish/calculate with the modified ingredient array.
    4. Display Updated Profile: The API returns a new, accurate allergen profile for the customized dish, which can be displayed to the user or the server for confirmation. The allergens_declared array might now be ["Eggs", "Sesame"], and the is_gluten_free flag might be true.

    Solving this problem is the mark of a truly sophisticated food tech platform. It demonstrates a commitment to safety and transparency that goes far beyond basic legal compliance. It’s the kind of feature that wins enterprise clients who understand the profound liability of getting it wrong.

    Displaying Allergen Information in a Restaurant App: Legal Requirements + UX Patterns

    Getting the data right on the backend is only half the battle. How you present it to the consumer is just as critical. Your UI/UX must be clear, unambiguous, and compliant.

    Legal & Accessibility Considerations

    • Clarity: Allergen information cannot be hidden or obscured. It must be easy to find and easy to read. Use clear headings and legible fonts.
    • Emphasis: Regulations like Natasha’s Law require allergens to be emphasized in ingredient lists (e.g., using bold, italics, or ALL CAPS).
    • Accessibility (WCAG): Ensure your display methods are accessible to users with disabilities. If you use color-coded icons, provide text labels for screen readers.

    Common UX Patterns

    1. Interactive Badges/Icons:
    * How it Works: Display a row of icons (e.g., a wheat stalk, a milk carton) next to each menu item. Icons for present allergens are highlighted. Tapping an icon can provide more detail.
    * Pros: Scannable, language-agnostic, visually appealing.
    * Cons: Can become cluttered. Ambiguous without a clear legend. Poor for displaying “may contain” information.

    2. Text Blocks & Expandable Sections:
    * How it Works: A simple, clear statement like “Contains: Wheat, Milk, Eggs.” is displayed below the item description. For more complex data, an expandable “Allergen & Ingredient Information” link reveals the full API response.
    * Pros: Unambiguous, excellent for detailed disclosure (including “may contain” and full ingredient lists), better for legal compliance.
    * Cons: Can be text-heavy if not designed carefully.

    The Best Approach: A Hybrid Model

    The most effective solution combines both. Use interactive icons for a quick at-a-glance summary of the most common declared allergens. But always provide a clearly labeled, accessible link or button that expands to show the full, detailed information returned by the API—including precautionary warnings and the complete ingredient statement.

    This layered approach serves both the casual user who just wants to avoid dairy and the highly sensitive user who needs to know if a product was processed in a facility that also handles tree nuts. It balances simplicity with comprehensive safety.


    Your menu is no longer a static piece of paper. It is a dynamic, interactive application interface. It carries the weight of your brand’s promise of quality and, more importantly, its commitment to guest safety. Relying on manual, brittle systems in this new environment is not a strategy; it’s an abdication of responsibility.

    The future of restaurant technology belongs to platforms that build on a foundation of accurate, real-time, and granular data. It belongs to those who see compliance not as a burden to be managed, but as an opportunity to build deep, lasting trust with their customers.

    Stop managing liability in a spreadsheet. Start engineering trust with an API.

    Power your restaurant tech with NutriGraphAPI at nutrigraphapi.com/pricing.
  • How to Build a Food Product Barcode Scanner with a Nutrition API (Step-by-Step)

    How to Build a Food Product Barcode Scanner with a Nutrition API (Step-by-Step)

    Your App’s Most Critical Feature is a Black Box

    Let’s be honest. You’re a CTO, a Lead Developer. You’re building the next great food, health, or diet application. You’ve architected the services, planned the data models, and sketched the UI. But there’s one feature that keeps you up at night: the barcode scanner.

    It seems simple. Point a camera, get a product. But the reality is a swamp of implementation details. You and your team spend weeks fighting with the low-level APIs in ZXing for Android or AVFoundation for iOS. You wrestle with camera permissions, focus modes, and decoding algorithms. Finally, it works. You scan a box of crackers, the numbers 8901234567890 appear on the screen, and you fire off a request to your backend.

    And that’s when the real problem emerges.

    Your nutrition data provider returns a 404 Not Found. Or worse, it returns the wrong product. You realize your expensive, enterprise-grade barcode lookup API food database doesn’t recognize the 13-digit EAN code from that European import. It only knows 12-digit American UPCs. Or it recognizes the code but gives you back a product name and a calorie count, leaving you to guess at allergens, dietary flags, and certifications.

    The barcode scanner isn’t just a technical hurdle; it’s the moment of truth for your user experience. When it fails, your app fails. The user churns, and your elegant architecture means nothing.

    This isn’t a front-end problem. It’s a data problem. And today, we’re going to solve it, end-to-end. We’ll show you how to pair a robust front-end scanning library with a truly intelligent backend—the NutriGraph API—to build a feature that not only works, but delivers unparalleled value to your users.


    Food Scan Genius App Scanner

    What a Barcode Lookup Actually Returns: UPC vs. EAN and Why It Matters

    Before writing a line of code, you must understand what your scanner is actually reading. A barcode is just a visual representation of a Global Trade Item Number (GTIN). Your API’s ability to handle the different formats is non-negotiable.

    Most developers think of the 12-digit UPC code. But the global standard is the 13-digit EAN. The distinction is critical.

    Barcode Type Digits Common Region Technical Detail
    UPC-A 12 North America A subset of EAN-13. Can be converted to EAN-13 by prepending a ‘0’.
    EAN-13 13 Worldwide The global standard. Most modern products, including those in the US, use EAN-13.
    ISBN 13 Books A specific use case of the EAN-13 format, typically starting with 978 or 979.

    The CTO’s takeaway: Your barcode lookup API for food must be EAN-native. If your API provider treats EAN-13 as an edge case or requires you to manually strip leading zeros to match UPC-A formats, you are building on a fractured foundation. This is a common point of failure for US-centric APIs that haven’t invested in a global food database.

    A modern, competent API endpoint should handle any valid GTIN you send it, whether it’s a 12-digit UPC from a box of Kraft Mac & Cheese or a 13-digit EAN from German dark chocolate. The logic should be on the server, not in your client-side code.


    Choosing the Right Barcode Scanning Library For Your Stack

    Now that we understand the data, let’s capture it. The goal here is not to reinvent the wheel but to choose a mature, well-supported library that handles the camera complexities for you. Your job is to orchestrate; let the library handle the low-level decoding.

    Here are our recommendations based on your target platform:

    For Native Mobile (iOS & Android)

    • iOS: AVFoundation

      • Why: It’s Apple’s native framework. This means maximum performance, seamless integration with the OS, and no third-party dependencies. It’s stable, powerful, and the clear choice for any native iOS app.
      • Implementation Note: You’ll work with AVCaptureSession, AVCaptureDevice, and AVCaptureMetadataOutput. The key is configuring the metadataObjectTypes to include .ean13 and .upca.
    • Android: ML Kit Barcode Scanning (via CameraX) or ZXing (“Zebra Crossing”)

      • Why ML Kit: Google’s modern, on-device machine learning solution is the preferred approach. It’s part of the Jetpack libraries, integrates beautifully with CameraX for a streamlined camera lifecycle, and is highly optimized.
      • Why ZXing: The battle-hardened veteran. ZXing is an open-source library that has been the de-facto standard for years. While more complex to integrate than ML Kit, it’s incredibly robust and gives you fine-grained control if you need it.
    ScanGeni Ventures Logo

    For Web & Progressive Web Apps (PWAs)

    • QuaggaJS or Scandit WebSDK
      • Why QuaggaJS: A great open-source option for web-based scanning. It uses getUserMedia to access the device camera and performs decoding directly in the browser. It’s highly configurable but may require more tuning for performance across different devices.
      • Why Scandit (Commercial): If you have the budget and demand enterprise-grade performance on the web, Scandit is a leader. Their WebSDK provides near-native scanning speed and accuracy in the browser, but it comes with a licensing fee.

    Regardless of your choice, the end goal is the same: to reliably extract a string of numbers (the GTIN) from the device’s camera feed. Once you have that string, you’re ready to unlock its meaning.


    Making Your First Barcode -> Food Data API Call

    This is the moment of truth. You have the GTIN. Now, you need to turn that meaningless number into actionable intelligence. With the NutriGraph API, this is a single, clean, RESTful API call.

    Our API is built on a simple premise: one product, one endpoint. No complex queries, no GraphQL gymnastics. Just the code.

    The endpoint is structured as follows:
    https://api.nutrigraphapi.com/v1/product/{gtin}

    Let’s use the EAN-13 code for our “Artisan Seed Crackers”: 8901234567890.

    You’ll need your developer API key, which you can pass in the X-API-KEY header.

    cURL Example

    Here’s how you’d test the endpoint directly from your terminal. Replace YOUR_API_KEY with the key you pull from our dashboard.

    curl -X GET \
      'https://api.nutrigraphapi.com/v1/product/8901234567890' \
      -H 'X-API-KEY: YOUR_API_KEY'
    

    JavaScript Fetch Example (Client-Side)

    Here’s how you would integrate it into your web or React Native application using the standard fetch API.

    const getProductData = async (barcode) => {
      const apiKey = 'YOUR_API_KEY'; // Store this securely, not hardcoded!
      const url = `https://api.nutrigraphapi.com/v1/product/${barcode}`;
    
      try {
        const response = await fetch(url, {
          method: 'GET',
          headers: {
            'X-API-KEY': apiKey,
            'Content-Type': 'application/json'
          }
        });
    
        if (!response.ok) {
          // Handle non-200 responses (404 Not Found, 401 Unauthorized, etc.)
          throw new Error(`API call failed with status: ${response.status}`);
        }
    
        const data = await response.json();
        console.log('Product Data:', data);
        return data;
    
      } catch (error) {
        console.error('Failed to fetch product data:', error);
        // Implement user-facing error handling here
      }
    };
    
    // Example usage after your scanner library returns a code
    getProductData('8901234567890');
    

    This is it. A single, logical request. We handle the complexity of matching UPCs, EANs, and our internal product graphs on our end. You send us a number; we send you the complete story of that product.


    Parsing the Response: Name, Allergens, and Dietary Tags in One Call

    Mediocre APIs give you data. Great APIs give you intelligence. The difference is in the depth and structure of the response. Many barcode lookup API food services will return a product name, brand, and maybe a partial nutrition label. This forces you to make subsequent API calls or run your own complex logic to determine if a product is vegan, gluten-free, or contains peanuts.

    This is inefficient and brittle. NutriGraph is designed to give you the definitive answer in a single call.

    Here is the exact, unedited JSON payload you receive for our “Artisan Seed Crackers” (8901234567890).

    {
      "status": "success",
      "gtin": "8901234567890",
      "productName": "Artisan Seed Crackers, Rosemary & Sea Salt",
      "brand": "Good Pantry Co.",
      "servingSize": "30g",
      "servingsPerContainer": 4.5,
      "verified": true,
      "lastUpdated": "2023-10-27T10:00:00Z",
      "nutrition": {
        "calories": 140,
        "fat": {
          "total": 7,
          "saturated": 1,
          "trans": 0
        },
        "cholesterol": 0,
        "sodium": 180,
        "carbohydrates": {
          "total": 16,
          "fiber": 3,
          "sugars": 1
        },
        "protein": 4
      },
      "ingredients": "Whole Wheat Flour, Water, Flax Seeds, Pumpkin Seeds, Sunflower Seeds, Sesame Seeds, Olive Oil, Rosemary, Sea Salt, Garlic Powder.",
      "allergens": {
        "contains": ["Wheat", "Sesame"],
        "mayContain": ["Soy", "Tree Nuts"]
      },
      "dietaryTags": {
        "positive": [
          "Vegan",
          "Vegetarian",
          "Dairy-Free",
          "High in Fiber",
          "No Added Sugar",
          "Whole Grain"
        ],
        "negative": [
          "Not Gluten-Free"
        ]
      },
      "qualityScores": {
        "nutriScore": "B",
        "novaGroup": 2
      },
      "labels": [
        "Vegan", "Vegetarian", "Dairy-Free", "High in Fiber", "No Added Sugar", "Whole Grain", 
        "Contains Wheat", "Contains Sesame", "May Contain Soy", "May Contain Tree Nuts",
        "Nutri-Score B", "NOVA Group 2", "Non-GMO Project Verified", "Kosher Certified",
        "Made with Olive Oil", "Source of Omega-3", "Good Source of Protein", "Low in Saturated Fat",
        "Cholesterol-Free", "No Artificial Flavors", "No Artificial Colors", "No Preservatives",
        "Recyclable Packaging", "Product of USA", "Family Owned Business", "Small Batch Crafted",
        "Keto Friendly (in moderation)", "Paleo Friendly (in moderation)", "Low Sugar", 
        "Contains Seeds", "Baked Not Fried", "Plant-Based", "High in Polyunsaturated Fats",
        "High in Monounsaturated Fats", "Low Cholesterol", "Trans Fat-Free",
        "Good Source of Magnesium", "Good Source of Iron", "Good Source of Zinc"
      ]
    }
    

    Dissecting the Intelligence:

    • allergens: We don’t just give you a list of ingredients and make you parse it. We explicitly separate what the product contains from what it mayContain (due to cross-contamination). This is a critical distinction for users with severe allergies.
    • dietaryTags: This is where the magic happens. We pre-process the ingredient and nutrition data to provide clear, boolean-like flags. Instead of you writing complex rules to determine if a product is Vegan, we’ve done the work. The positive and negative arrays allow you to build powerful filtering and UX patterns instantly.
    • qualityScores: We include established food scoring systems like nutriScore (Europe) and novaGroup (processing level) out of the box, giving you objective health metrics.
    • labels: The labels array is your secret weapon. With 39 distinct, human-readable labels for a single product, you can create a rich, searchable, and informative user experience that no competitor can match. This is the depth required to win.

    Handling Lookup Failures: Product Not Found, Partial Data, Unverified Products

    A production system is defined by how it handles failure. No food database is 100% complete. New products are launched daily. Your application must be resilient.

    Here are the three scenarios you must plan for:

    1. 404 Not Found: The barcode is valid, but it doesn’t exist in our database. This is your opportunity for user engagement.

      • UX Best Practice: Don’t just show an error. Display a message like, “Product not found. You’re the first to scan this!” and present a simple form allowing the user to take a picture of the product and its nutrition panel. You can then submit this data to us (or your own system) to improve the database. This turns a moment of failure into a feeling of contribution.
    2. Partial Data: The API returns a 200 OK, but some fields might be missing. For example, a new product might have basic information but is still pending full dietary analysis.

      • UX Best Practice: Design your UI to degrade gracefully. If dietaryTags is null or empty, hide that section of the UI. Don’t show an empty state that looks like a bug. Your code should check for the existence of keys before attempting to render them.
    3. Unverified Products ("verified": false): Our system may have ingested data from a third-party source that hasn’t been manually verified by our nutritionists yet. We flag this explicitly in the API response.

      • UX Best Practice: Display a small, non-intrusive warning to the user. A simple info icon with a tooltip that says, “This information has been automatically sourced and is pending verification,” is often sufficient. This builds trust by being transparent about data quality.

    Displaying the Data: UX Patterns for Allergen Warnings and Dietary Badges

    Raw JSON doesn’t help your users. Your final task is to translate that rich data payload into a clear, intuitive interface.

    Think in terms of traffic lights: Red, Yellow, Green.

    • Red (Warnings): User-defined allergens should be front and center. If a user has a Peanut allergy and the allergens.contains array includes "Peanuts", this requires a high-priority warning. A red banner at the top of the screen is a common and effective pattern.

      UI Snippet:
      [X] CONTAINS WHEAT (Rendered in red)
      [!] MAY CONTAIN SOY (Rendered in orange/yellow)

    • Green (Confirmations): Use the dietaryTags.positive array to reward the user’s choices. If they are on a Vegan diet, a prominent green badge or checkmark confirms the product is compliant.

      UI Snippet:
      [✓] Vegan
      [✓] High in Fiber
      [✓] Gluten-Free

    • Neutral (Information): The labels array is perfect for a tag cloud or a list of bullet points that gives a quick, scannable overview of the product’s features. This is where you can show off the depth of your data and let users discover new things about the product.

    By mapping the API response directly to these established UX patterns, you can build a feature-rich product screen in a fraction of the time it would take to compute this logic yourself.


    Performance Considerations: Caching, Rate Limits, and Offline Fallback

    Your barcode scanner needs to feel instantaneous. Network latency is your enemy. Here’s how to build a production-grade, high-performance feature.

    • Caching: The contents of a food product rarely change. A scanned product is a perfect candidate for caching. Implement a client-side cache (e.g., using React Query, SWR, or even simple localStorage) with a Time-To-Live (TTL) of 24 hours. This prevents needless API calls when a user scans the same item multiple times in a shopping trip.

    • Rate Limits: Like any robust API, NutriGraph has rate limits to ensure quality of service for everyone. Your free developer key includes a generous limit, but in production, you must code defensively. Use a token bucket algorithm or exponential backoff for retries if you ever receive a 429 Too Many Requests response.

    • Offline Fallback: What happens in a grocery store with poor cell service? The best apps plan for this. When a scan is successful, save the GTIN and the full JSON response to a local device database (like SQLite or Realm). If the user scans the same product later while offline, you can instantly serve the cached data. If they scan a new product while offline, add the GTIN to a queue and process it once connectivity is restored.

    Your Path Forward

    You started with one of the most deceptively complex features in app development. A journey fraught with low-level camera APIs, inconsistent barcode formats, and shallow data that leaves your users wanting more.

    Now, you have a clear, strategic playbook. Combine a best-in-class frontend scanning library with the deep, structured, and reliable data from the NutriGraph API. You can bypass the weeks of wasted effort and focus on what you do best: building a phenomenal user experience.

    Stop fighting with data. Start building with intelligence.

    Pull a Free 1,000-Call Developer Key at nutrigraphapi.com/pricing and make your first API call in the next five minutes.


  • EU Food Allergen Labelling Requirements: What Developers Need to Know (FIC 1169/2011 Guide)

    EU Food Allergen Labelling Requirements: What Developers Need to Know (FIC 1169/2011 Guide)

    Stop reading 500-page European Union legal PDFs. They weren’t written for you. They were written by lawyers, for lawyers, and they’re a minefield of ambiguity designed to protect institutions, not your app.

    If you are building a food, health, or restaurant application for the European Union market, you are not just a developer. You are a publisher of regulated information. And when it comes to food, the regulations are not suggestions. They are strict, legally-binding requirements. Your code is now subject to food law.

    At the center of this is Regulation (EU) No 1169/2011 on the provision of Food Information to Consumers, or FIC. This is the law that governs every piece of food information—especially allergens—presented to an EU consumer. Getting it wrong isn’t a bug you can patch later. It’s a compliance failure that can lead to crippling fines, user lawsuits, and the destruction of your brand’s credibility before it even gets off the ground.

    This is not a scare tactic. It’s a market reality. Your competitors, like Spoonacular, provide a vast ocean of data, but navigating compliance is left to you. They give you a dictionary, but you’re still on the hook for writing the novel. That’s a dangerous place to be.

    We’re here to give you the developer-friendly translation of the law, the UI best practices to mitigate your liability, and most importantly, the exact JSON data structure you need to satisfy every clause. This is the blueprint for turning a legal nightmare into a simple, reliable API call.

    What is FIC Regulation 1169/2011?

    In simple terms, FIC 1169/2011 is the EU’s single, unified rulebook for food labelling. It was created to replace a patchwork of older directives and make food information clear, legible, and consistent for consumers across all member states. For a CTO or developer, you can think of it as a strict data schema for food.

    The Regulation’s core principle is transparency. A consumer must be able to know, without ambiguity, what is in their food. This is especially critical for the millions of people with food allergies, for whom a missing piece of information can be a life-or-death matter.

    From a technical standpoint, FIC mandates three key things that directly impact your application:

    1. Mandatory Information: A specific list of details must be present for most prepacked foods, including the name of the food, a list of ingredients, and nutrition information.
    2. Allergen Highlighting: Any of the 14 mandatory allergens present in the ingredients must be emphasized in the ingredients list. The law specifies this can be through a change in font, style (like bolding or italics), or background color.
    3. Clarity and Legibility: The information must be easy to read and understand. For digital applications, this translates directly to UI/UX design. Hiding allergen information behind multiple clicks or in a tiny font is a direct violation of the spirit, and likely the letter, of the law.

    Your responsibility is to ensure that the data you pull from an API and render in your app’s UI is a perfect, compliant reflection of these rules. The Regulation doesn’t care if your data source was inaccurate. The liability falls on the Food Business Operator (FBO), and your platform is now part of that chain.

    Food Scan Genius App Scanner

    The EU 14 Mandatory Allergens: Your Core Data Requirement

    FIC annex II lists 14 substances or products that cause the majority of food allergies and intolerances in Europe. You must explicitly declare the presence of any of these in your product data. This is not negotiable. Let’s break down the list, with specific technical considerations you need to be aware of.

    1. Cereals containing gluten: namely wheat (such as spelt and khorasan wheat), rye, barley, oats.
    2. Crustaceans: for example prawns, crabs, lobster, crayfish.
    3. Eggs.
    4. Fish.
    5. Peanuts.
    6. Soybeans.
    7. Milk (including lactose).
    8. Nuts: namely almonds, hazelnuts, walnuts, cashews, pecan nuts, Brazil nuts, pistachio nuts, macadamia or Queensland nuts.
    9. Celery.
    10. Mustard.
    11. Sesame seeds.
    12. Sulphur dioxide and sulphites: This is a critical nuance. They only need to be declared if they are present at concentrations of more than 10 mg/kg or 10 mg/litre in terms of the total SO2. Your data source must be able to provide this level of quantitative detail, not just a simple boolean. A generic API often fails here.
    13. Lupin: A type of legume, common in some parts of Europe as a flour substitute.
    14. Molluscs: for example mussels, oysters, squid, snails.

    Your system must be architected to handle each of these 14 points as a distinct data field. A simple tags: ["nuts", "dairy"] array from a generic food API is insufficient and dangerous. You need granular, boolean flags for each specific allergen as defined by the law.

    PPDS (Prepacked for Direct Sale): The Natasha’s Law Update

    On October 1, 2021, the rules in the UK tightened significantly due to a tragic event. A teenager named Natasha Ednan-Laperouse died from an allergic reaction to a pre-packaged baguette that, under the old rules, did not require individual allergen labelling. This led to Natasha’s Law.

    This law specifically targets food that is Prepacked for Direct Sale (PPDS). This is food that is packaged at the same place it is offered or sold to consumers and is in its packaging before it is ordered or selected.

    Think about:
    * A sandwich or salad packaged by a cafe and placed on a shelf for customers to grab.
    * A butcher who packages sausages or pies on-site to be sold from a counter.
    * A food truck selling pre-boxed meals.

    If your application facilitates the sale of any food item that falls under the PPDS definition in the UK (and similar interpretations are being adopted across the EU), you are now required to display full ingredient and allergen information for that item. The old exception of simply having a sign telling customers to ask staff is gone.

    What this means for your app:

    Your platform’s responsibility just expanded. If you are a delivery aggregator, a restaurant discovery app, or provide a digital menu platform, you are now a conduit for PPDS information. You must have a system capable of ingesting and displaying full, accurate, and highlighted allergen information for every single PPDS item offered by your partners. This requires a robust API and a data model that can handle product-level variations, not just a generic restaurant menu.

    What ‘May Contain’ and Cross-Contamination Declarations Require By Law

    This is one of the most misunderstood areas of food labelling, and a place where technical teams often make critical errors. There is a legal and practical difference between an allergen being an ingredient and an allergen being present due to cross-contamination.

    FIC 1169/2011 itself covers allergens present as ingredients. The use of precautionary allergen labelling (PAL), such as “may contain nuts” or “produced in a factory that handles shellfish,” is not specifically regulated by FIC. Instead, it falls under general food safety law (Regulation 178/2002), which states that food must not be placed on the market if it is unsafe.

    An FBO will use a “may contain” statement after a thorough risk assessment reveals a genuine, unavoidable risk of cross-contamination. It is not a legal loophole to cover for poor manufacturing practices.

    For your app, this means your data structure must differentiate:

    1. Intentional Allergens: Allergens that are part of the product’s recipe (e.g., has_peanuts: true). These must be highlighted in the ingredient list.
    2. Precautionary/Advisory Allergens: Allergens that are not in the recipe but could be present due to shared equipment or environment (e.g., allergen_advisory_statement: "May contain traces of milk."). This information should be displayed clearly, but separately from the main ingredient list, to avoid confusing the user.

    A generic API that lumps these two distinct types of data into a single array is setting you up for failure. It either overstates the risk (confusing users) or understates it (creating liability). You need an API that understands the law and provides separate, structured fields for both.

    ScanGeni Ventures Logo

    How to Implement EU-Compliant Allergen Display In Your Food App

    Your backend can be perfectly compliant, but if the front-end presentation is poor, you are still liable. The law requires information to be clear and legible. Here are the non-negotiable best practices for your UI/UX.

    1. The Ingredient List is Sacred

    For any product with an ingredient list, the 14 EU allergens must be visually emphasized. The most common and legally sound method is bolding.

    • Bad: Ingredients: Wheat flour, sugar, egg, milk powder, vanilla extract.
    • Good: Ingredients: **Wheat** flour, sugar, **egg**, **milk** powder, vanilla extract.

    Your UI components must be able to parse and render this formatting directly from the data you receive.

    2. The Allergen Summary Box

    In addition to highlighting within the ingredients, it is best practice to provide a clear, easy-to-read summary box. This is where you declare the presence of allergens.

    • Contains: List the allergens that are intentional ingredients. Use clear, unambiguous language. For example: Contains: Wheat, Egg, Milk.
    • May Contain: If your API provides a precautionary statement, display it separately and clearly. For example: May Contain: Nuts, Soya.

    This two-tiered approach provides maximum clarity for the user and demonstrates your due diligence.

    3. Use Icons, But With Text Labels

    Allergen icons can be a great visual aid, but they are not a substitute for text. There is no universally standardized set of allergen icons, and relying on them alone can lead to misinterpretation.

    • Best Practice: Display a clear icon (e.g., a peanut icon) along with the text label “Peanuts”. This combination is both scannable and unambiguous.

    4. Filter and Search Functionality

    Empower your users. Your application should allow users to set their allergen profiles and filter out unsuitable products. This is not just a feature; it’s a critical safety tool. This requires your backend data to be granular and accurate. You cannot build a reliable “Contains Nuts” filter if your API just gives you a vague tag.

    A Warning on Legal Liability

    Do not bury this information. It should be one click away from the main product page, at most. Add a clear disclaimer to your app’s Terms of Service stating that users with severe allergies should always take extra precautions and that your data is for informational purposes. However, a disclaimer will not protect you if your data is proven to be systematically negligent or inaccurate. The quality of your data partner is your first and most important line of defense.

    Mapping FIC Requirements to API Fields: A Developer Reference Table

    This is where theory meets execution. A compliant system is impossible without a compliant data structure. A generic food API gives you unpredictable strings in an array. A purpose-built compliance API like NutriGraphAPI gives you a predictable, boolean-based schema that maps directly to the law. There is no room for interpretation, and no string parsing required.

    Below is a direct mapping of the EU 14 allergens and related compliance data to the fields you’ll find in a NutriGraphAPI JSON response. This is the data structure you need to demand from your provider.

    EU Legal Requirement (FIC 1169/2011 Annex II) NutriGraphAPI JSON Field Data Type Example Value Implementation Notes
    Cereals containing gluten allergens.has_gluten boolean true Master flag for all gluten-containing cereals.
    – Wheat allergens.contains_wheat boolean true Specific grain. Allows for filtering for non-wheat gluten sources like barley.
    – Rye allergens.contains_rye boolean false Specific grain.
    – Barley allergens.contains_barley boolean false Specific grain.
    – Oats allergens.contains_oats boolean false Specific grain. Important for users who can tolerate gluten-free oats but not other cereals.
    Crustaceans allergens.has_crustaceans boolean false Covers prawns, crabs, lobster, etc.
    Eggs allergens.has_eggs boolean true Clear and unambiguous.
    Fish allergens.has_fish boolean false Clear and unambiguous.
    Peanuts allergens.has_peanuts boolean true Legally distinct from tree nuts. Never bundle them.
    Soybeans allergens.has_soy boolean true Note the field name has_soy for developer convenience.
    Milk allergens.has_milk boolean true Covers all milk products, including lactose.
    Nuts allergens.has_tree_nuts boolean true Master flag for all tree nuts listed in FIC.
    – Almonds allergens.contains_almonds boolean true Specific nut type.
    – Hazelnuts allergens.contains_hazelnuts boolean false Specific nut type.
    – Walnuts allergens.contains_walnuts boolean false Specific nut type.
    – Cashews allergens.contains_cashews boolean false Specific nut type.
    – Pecan nuts allergens.contains_pecans boolean false Specific nut type.
    – Brazil nuts allergens.contains_brazil_nuts boolean false Specific nut type.
    – Pistachio nuts allergens.contains_pistachios boolean false Specific nut type.
    – Macadamia nuts allergens.contains_macadamia boolean false Specific nut type.
    Celery allergens.has_celery boolean false Clear and unambiguous.
    Mustard allergens.has_mustard boolean false Clear and unambiguous.
    Sesame seeds allergens.has_sesame boolean false Clear and unambiguous.
    Sulphur dioxide and sulphites allergens.has_sulphites boolean false This boolean is only true if the concentration is > 10 mg/kg or 10 mg/L.
    – Sulphite Concentration (ppm) allergens.sulphites_ppm integer 0 Provides the quantitative data for custom logic or display, where ppm (parts per million) is equivalent to mg/kg.
    Lupin allergens.has_lupin boolean false Clear and unambiguous.
    Molluscs allergens.has_molluscs boolean false Covers mussels, squid, oysters, etc.
    Cross-Contamination & PAL allergen_advisory_statement string "May contain traces of tree nuts and soy." Precautionary Allergen Labelling (PAL). A null or empty string means no statement was provided. Display this separately from the main allergen list.
    Formatted Ingredient List ingredients_formatted_html string "Ingredients: <strong>Wheat</strong> flour, sugar, <strong>egg</strong>, <strong>milk</strong> powder." Provides a pre-formatted, legally compliant string with allergens already bolded. Ready to render in a web view. This eliminates parsing errors.

    This is what a compliance-first data structure looks like. It is predictable, granular, and removes the burden of legal interpretation from your development team. You are no longer guessing; you are simply mapping fields to your UI.

    Beyond the EU: FDA FASTER Act (Sesame), Australia/NZ, and Global Allergen Standards

    The world of food regulation is not static. What is compliant today may be incomplete tomorrow. A prime example is the FASTER Act of 2021 in the United States, which officially added sesame to the list of major food allergens, a change that took effect on January 1, 2023.

    Australia and New Zealand, governed by the Food Standards Code, have a similar list to the EU but also include other allergens like royal jelly. Canada has its own list of priority allergens.

    The point is this: allergen regulations are a moving target. If you are building a global or multi-region application, hard-coding allergen lists or relying on a data provider that only focuses on one region is a recipe for technical debt and compliance risk.

    You need a partner whose business is to stay ahead of these changes. When the FASTER Act was passed, NutriGraphAPI’s schema already had a has_sesame field. For our customers, the transition was seamless. For developers using other APIs, it was a scramble to update their code and data processing.

    Building on a compliance-focused API is not just about solving today’s problem for the EU. It’s about future-proofing your application against the inevitable evolution of global food law.

    Your job is to build a great application. Our job is to handle the Byzantine complexity of food regulation and deliver it to you in a simple, clean, and reliable JSON object.

    Stop trying to become a legal expert. Stop building risky parsers for unreliable data. Focus on your product and let the data do the work.

    See how NutriGraphAPI mathematically maps to EU allergen requirements at nutrigraphapi.com/docs and pull your Sandbox key.


  • Driving API Performance: Achieving Sub-150ms Latency & Caching Strategies

    Driving API Performance: Achieving Sub-150ms Latency & Caching Strategies

    A slow food API is a silent killer. It doesn’t crash your app with a spectacular error log. It just quietly bleeds you of your users, one by one. Picture this: a health-conscious user is standing in a grocery aisle. They’re on a spotty 3G connection. They scan a barcode, your app spins a loading wheel for two, maybe three seconds. In that brief moment of frustration, a decision is made. They don’t just close the app. They uninstall it. And they never come back.

    That’s not a technical problem; it’s a business problem. That’s a failure of the experience. In the world of health and nutrition tech, speed isn’t a feature—it’s the foundation of trust. Your users rely on you for instant, accurate information to make decisions about what they put in their bodies. A delay isn’t an inconvenience; it’s a breach of that trust.

    We’re not here to talk about marginal gains. We’re here to talk about the architectural decisions that separate a category-defining application from a deleted one. This isn’t just another blog post. This is a technical whitepaper for CTOs and lead developers who understand that user retention is built on a bedrock of sub-50 millisecond response times. We’re going to dissect the problem of latency, expose the failings of legacy systems, and give you the playbook for building a data-driven nutrition app that feels like magic.


    The Hidden Cost of Latency in Health-Tech Applications

    In most industries, latency is measured in dollars. In health-tech, it’s measured in user churn. The cost of a slow API isn’t just a line item on a server bill; it’s a compounding debt that erodes your user base, tarnishes your brand, and ultimately starves your business of growth.

    Think about the critical moments in your user’s journey:

    1. The Point of Decision: A user is at a restaurant drive-thru, trying to quickly look up the calories at Sonic for two different burger options. If your app takes longer than it takes for the car in front of them to move, they’ve abandoned the search and made a blind choice. Your app failed its one job at the most crucial moment.
    2. The Meal Prep Routine: A user is planning their meals for the week, adding a dozen items to their log. If each item takes 1.5 seconds to fetch and process, what should be a 30-second task becomes a multi-minute chore. They will find a faster tool.
    3. The Barcode Scan: This is the ultimate test. It’s an interactive, real-world engagement. The expectation is instant feedback, like a retail price checker. Anything less than 500ms feels broken. Anything over a second is a death sentence.

    According to data from Google, a 1-second delay in mobile page load times can impact conversion rates by up to 20%. For an in-app API call, the psychological impact is even greater. It’s not an anonymous webpage; it’s a tool they’ve chosen to install and trust. A delay feels like a personal failure of the product.

    This friction accumulates. It leads to:

    • Negative App Store Reviews: Users don’t write, “The API had a p95 latency of 1800ms.” They write, “This app is slow and clunky. Useless. 1 star.” These reviews are a permanent stain on your acquisition funnel.
    • Reduced Engagement: Users who experience frequent delays learn to use the app less. They stop scanning, they stop logging, and eventually, they stop opening it altogether.
    • Increased Churn: The final outcome. Once a user finds a faster alternative, you will not get them back. The cost of acquiring a new user is 5x higher than retaining an existing one, making latency a direct assault on your company’s profitability.

    Latency isn’t a rounding error in your performance metrics. It’s the single greatest technical threat to your product’s success. Your choice of a data provider is, therefore, one of the most critical architectural decisions you will make.


    Food Scan Genius App Scanner

    Why Legacy APIs (like Edamam/Spoonacular) Slow Down on Complex Allergen Queries

    Many product teams start with a legacy food API because it seems convenient. They have large datasets, and they’ve been around for a while. But these platforms were often built on monolithic architectures designed for a different era of the internet. Their foundations are ill-suited for the demands of modern, interactive mobile applications, and the cracks begin to show the moment you ask a difficult question.

    The problem lies in the data model and indexing strategy. A typical legacy system might use a massive, normalized SQL database. When a user performs a simple search, like fetching a single product by UPC, it’s reasonably fast. But your users have more complex needs.

    Consider this query: “Show me all the chicken sandwiches at Sonic that are gluten-free, dairy-free, but not soy-free.”

    On a legacy API, here’s what’s likely happening under the hood:

    1. A full-text search is performed on a foods table with millions of rows to find items containing “chicken sandwich” and belonging to the “Sonic” brand.
    2. The resulting IDs are then joined against a food_allergens link table.
    3. A complex WHERE clause with multiple NOT IN or LEFT JOIN...IS NULL conditions is applied to filter out gluten, dairy, and include soy.

    This is a database nightmare. The query planner struggles, indexes might not be fully utilized, and the database is forced to perform multiple scans and joins across massive tables. The response time balloons from milliseconds to multiple seconds, especially under concurrent load. The database becomes the bottleneck for the entire system.

    This architectural flaw is why so many apps powered by older APIs feel sluggish. They are optimized for simple key-value lookups, not for the complex, multi-faceted queries that real users perform every day. They can’t efficiently answer whether a specific menu item is both low-carb and nut-free without a performance penalty that gets passed directly to your user, who is still waiting in that drive-thru line.

    They have a large database, but it’s a library with a disorganized card catalog. We didn’t just build a library; we indexed every word on every page.


    How NutriGraphAPI Achieves Sub-150ms Latency (O(1) B-Tree Indexing, Edge Computing)

    We didn’t set out to build a slightly faster API. We set out to solve the latency problem from first principles. Our entire architecture is purpose-built for one thing: delivering comprehensive nutrition data with predictable, ultra-low latency, regardless of query complexity. We achieve this through a multi-layered approach.

    O(1) B-Tree & Hash Map Indexing

    Our data is not stored in a conventional relational structure. We use a combination of data stores optimized for specific access patterns. The core of our system is a custom-built search index inspired by the principles of modern search engines.

    • UPC/Barcode Lookups: Every barcode (UPC/EAN) is stored as a key in a distributed hash map. This means a lookup is an O(1) operation. It’s the fastest possible access pattern, providing a response in single-digit milliseconds (excluding network time). There is no database query, no join, no calculation.
    • Branded Food Lookups: A search for “calories at sonic” doesn’t trigger a LIKE '%sonic%' query. Instead, we use inverted indexes, a core component of B-Tree data structures. The term “sonic” maps directly to a list of document IDs for every food item associated with the brand. This lookup is an O(log n) operation, which for all practical purposes is nearly instantaneous across our massive dataset.
    • Compound Allergen Queries: We pre-compute and materialize results for common attribute combinations. Allergen and dietary information (e.g., ‘gluten-free’, ‘vegan’) are treated as tags in our index. When a query comes in for “gluten-free and dairy-free,” we perform a rapid intersection of two pre-sorted lists of document IDs. This is orders of magnitude faster than a traditional SQL join.
    ScanGeni Ventures Logo

    Edge Computing & Global Caching

    Database performance is only half the battle. The speed of light is a hard limit, and the distance between your server and your user is a major source of latency. A user in Sydney making a request to a server in Virginia, USA will always have a minimum of 200-250ms of round-trip-time (RTT) latency before your server even begins processing the request.

    NutriGraphAPI is deployed on a global edge network. This means:

    • Edge Termination: User requests are terminated at an edge server closest to them—be it in London, Tokyo, or São Paulo. This dramatically reduces RTT.
    • Intelligent Caching: Our most frequently accessed data—the nutrition profile for a Coca-Cola, the list of items at McDonald’s—is cached at these edge locations. For a huge percentage of your requests, the answer is delivered directly from the edge, resulting in response times that are consistently below 150ms.
    • Tiered Backends: If the data isn’t at the edge, the edge server makes an optimized, persistent connection to the nearest regional backend, which in turn queries our core data stores. This entire network is tuned for speed.

    By combining a superior data indexing strategy with a globally distributed infrastructure, we move the processing and the data as close to the user as physically possible. That is how you deliver a truly instantaneous experience.


    Implementing a Redis Cache for Your Barcode Requests

    Even with a sub-150ms API, a well-implemented local cache is a critical component of a high-performance application. Caching on your backend reduces redundant API calls, lowers your costs, insulates you from transient network issues, and provides an additional speed boost for repeat requests.

    Redis is an in-memory key-value store that is perfect for this task. Let’s walk through a simple but powerful implementation in Python for caching barcode lookups.

    The Goal: Before calling the NutriGraphAPI for a given UPC, we’ll first check our Redis cache. If the data is there (a cache hit), we’ll return it instantly. If not (a cache miss), we’ll call the API, store the result in Redis with a Time-To-Live (TTL), and then return it.

    Here is a code snippet demonstrating the pattern:

    import redis
    import requests
    import json
    import os
    
    # --- Configuration ---
    # Best practice: Use environment variables for sensitive data
    NUTRIGRAPH_API_KEY = os.environ.get('NUTRIGRAPH_API_KEY')
    NUTRIGRAPH_API_URL = 'https://api.nutrigraphapi.com/v1/upc'
    REDIS_HOST = 'localhost'
    REDIS_PORT = 6379
    
    # --- Redis Connection ---
    # Use a connection pool in a real application
    r = redis.Redis(host=REDIS_HOST, port=REDIS_PORT, db=0, decode_responses=True)
    
    def get_nutrition_by_upc(upc_code: str):
        """
        Fetches nutrition data for a given UPC, utilizing a Redis cache.
        """
        # 1. Define the cache key
        cache_key = f"upc:{upc_code}"
    
        # 2. Try to fetch from Redis first (Cache Hit)
        try:
            cached_data = r.get(cache_key)
            if cached_data:
                print(f"CACHE HIT for UPC: {upc_code}")
                return json.loads(cached_data)
        except redis.exceptions.ConnectionError as e:
            print(f"Redis connection error: {e}. Bypassing cache.")
    
        # 3. If not in cache, call the API (Cache Miss)
        print(f"CACHE MISS for UPC: {upc_code}. Fetching from NutriGraphAPI.")
        headers = {
            'Authorization': f'Bearer {NUTRIGRAPH_API_KEY}'
        }
        params = {
            'upc': upc_code
        }
    
        try:
            response = requests.get(NUTRIGRAPH_API_URL, headers=headers, params=params)
            response.raise_for_status() # Raises an HTTPError for bad responses (4xx or 5xx)
            api_data = response.json()
    
            # 4. Store the API response in Redis with a TTL
            # Set TTL to 24 hours (86400 seconds). Adjust based on how often your data might change.
            try:
                r.setex(cache_key, 86400, json.dumps(api_data))
            except redis.exceptions.ConnectionError as e:
                print(f"Redis connection error on setex: {e}. Could not cache response.")
    
            return api_data
    
        except requests.exceptions.RequestException as e:
            print(f"API request failed: {e}")
            # Handle API errors appropriately (e.g., return a default error object)
            return None
    
    # --- Example Usage ---
    if __name__ == '__main__':
        # Example UPC for a popular soda
        sample_upc = '049000028904'
    
        # First call - should be a CACHE MISS
        data1 = get_nutrition_by_upc(sample_upc)
        if data1:
            print(f"Fetched data: {data1['name']}")
    
        print("\n--------------------\n")
    
        # Second call - should be a CACHE HIT
        data2 = get_nutrition_by_upc(sample_upc)
        if data2:
            print(f"Fetched data: {data2['name']}")
    

    Key Considerations:

    • Cache Key Strategy: A consistent naming convention like object_type:id is crucial. Here, upc:049000028904 is clear and avoids collisions.
    • Time-To-Live (TTL): The setex command in Redis sets a key with an automatic expiration. This is vital. You don’t want to serve stale nutrition data indefinitely. A TTL of 24 hours is a reasonable starting point for most CPG products.
    • Error Handling: Notice the try...except blocks. Your application must be resilient to cache failures. If Redis is down, your logic should gracefully bypass it, call the API directly, and continue serving the user.
    • Serialization: Redis stores strings. We use json.dumps() to serialize our Python dictionary before storing it and json.loads() to deserialize it upon retrieval.

    Implementing this pattern for your most frequent queries is a low-effort, high-impact optimization that will dramatically improve your application’s performance and resilience.


    Rate Limiting vs Throttling: How to Scale to 1,000,000 Users Without Breaking the Bank

    As your application grows, managing API usage becomes critical for both performance and cost control. The terms “rate limiting” and “throttling” are often used interchangeably, but they represent different strategies for controlling traffic.

    Rate Limiting is a hard ceiling. It says, “You are allowed a maximum of 100 requests per second. The 101st request within that second will be rejected,” typically with a 429 Too Many Requests status code. This is a blunt instrument, effective at preventing abuse and denial-of-service attacks, but it can create a poor user experience. A sudden, legitimate burst of traffic—like thousands of users opening your app at 9 AM—could cause requests to fail, leaving users with errors.

    Throttling is a more graceful approach. It’s about shaping the flow of traffic. The most common algorithm is the “token bucket.” Imagine a bucket that can hold 100 tokens. Tokens are added to the bucket at a steady rate, say 50 per second. Each API request consumes one token. If a burst of 100 requests arrives, they can all be processed immediately by emptying the bucket. Subsequent requests must then wait for new tokens to be added. This allows your application to handle legitimate bursts while ensuring the average request rate stays within a sustainable limit.

    At NutriGraphAPI, we employ a sophisticated throttling system. We understand that application traffic is naturally bursty. Our system is designed to absorb these peaks without rejecting requests, providing a smooth and reliable experience for your end-users. This means you don’t have to over-provision your plan to handle peak load, and you don’t have to implement complex client-side retry logic to handle rejected requests.

    For your own architecture, this distinction is key. When communicating with third-party APIs, understand their policy. For your own internal services, consider a throttling approach to improve resilience. By partnering with a provider like NutriGraphAPI that throttles intelligently, you remove a major scaling headache and can focus on building features, confident that the underlying infrastructure can handle the load as you scale to your first million users and beyond.


    Asynchronous vs Synchronous Fetching for Meal Planning Apps

    Architectural choices on the client-side are just as important as the server-side. The way you fetch data can be the difference between an app that feels fluid and one that feels frozen. This is especially true in features like meal planning, where a user might perform multiple data-intensive actions in quick succession.

    Let’s consider a user building a recipe. They add five ingredients to their list.

    The Synchronous Approach (The Wrong Way):

    1. User adds “1 cup of flour.”
    2. App sends API request for “flour.” Waits.
    3. API responds. App UI updates.
    4. User adds “2 eggs.”
    5. App sends API request for “eggs.” Waits.
    6. API responds. App UI updates.
    7. …and so on.

    Each action blocks the next. The total time to add five ingredients is the sum of all five individual API call latencies. The UI feels laggy and unresponsive. If one request is slow, the entire process grinds to a halt.

    The Asynchronous Approach (The Right Way):

    1. User adds “1 cup of flour.”
    2. User adds “2 eggs.”
    3. User adds “100g of butter.”
    4. The app fires off three API requests in parallel.
    5. As each request completes, its respective UI element is updated independently.

    The total time to process all requests is now dictated by the single slowest request, not the sum of all of them. In JavaScript, this can be easily implemented with Promise.all or by handling each promise individually. The user experiences a fluid, non-blocking interface where they can continue working while data is fetched in the background.

    This pattern is only viable if your API provider can handle the concurrent load. A legacy API might falter under 5-10 parallel requests from a single client, either through strict rate limiting or because its own database becomes a bottleneck. NutriGraphAPI’s architecture is built for this kind of concurrency. Our low latency and efficient processing mean that asynchronous patterns are not just possible; they are the recommended way to build the best possible user experience. We give you the speed you need to build interfaces that feel instantaneous.


    Your choice of a data provider is not an implementation detail; it is a foundational product decision. It dictates the speed of your application, the satisfaction of your users, and your ability to scale. You can build on legacy infrastructure that treats speed as an afterthought, or you can build on a modern platform designed from the ground up for performance.

    Don’t let a slow API be the silent killer of your app. Don’t take our word for it.

    Test our latency against your current provider at nutrigraphapi.com/pricing.

  • Optimizing Food API Performance: Achieving Sub-150ms Latency & Caching Strategies

    Optimizing Food API Performance: Achieving Sub-150ms Latency & Caching Strategies

    A user stands in a grocery aisle. They scan a product with your app, hoping for instant allergen information. One second passes. Two seconds. The progress spinner, a tiny symbol of failure, keeps turning on their spotty 3G connection. They close the app. Later that day, they delete it.

    This isn’t a hypothetical. This is the moment you lose a customer. In the hyper-competitive health-tech space, performance isn’t a feature; it’s the foundation of user trust and retention. A slow food API doesn’t just create a sluggish experience—it signals an unreliable product. When your application is a critical tool for managing health, diet, or allergies, unreliability is fatal.

    This is not another high-level blog post about “the importance of speed.” This is a CTO and Lead Developer’s guide to the architectural decisions that separate a category-defining application from a deleted one. We will dissect the technical reasons legacy APIs fail under pressure and lay out the precise strategies—from database indexing to edge computing—required for optimizing food API performance to achieve the sub-150ms latency that modern users demand.

    The Hidden Cost of Latency in Health-Tech Applications

    We tend to think of latency in milliseconds, an abstract number on a monitoring dashboard. But your users experience it in heartbeats. For a health-tech app, that delay is measured in frustration, anxiety, and a complete breakdown of trust.

    The financial equation is brutal and direct:

    • High Latency → Poor User Experience → Increased Churn: Google found that a 400-millisecond delay leads to a measurable drop in user engagement. For a health app where a user might be making critical dietary choices, the tolerance is even lower. A 2-second delay feels like an eternity and is often interpreted as a broken app.
    • Increased Churn → Higher Customer Acquisition Cost (CAC): A leaky bucket is expensive to fill. If you are churning users due to poor performance, your marketing spend is effectively being incinerated. You have to acquire more new users just to maintain a stagnant growth curve.
    • Poor UX → Negative App Store Reviews: Users don’t write reviews saying, “The API latency on complex queries appears to be O(n^2).” They write, “App is slow and crashes,” and give you one star. These reviews are a permanent stain on your brand, deterring new downloads and driving your blended CAC even higher.

    Latency isn’t a line item in your P&L, but it’s a silent tax on your entire business. Every millisecond you shave off your API response time is a direct investment in user retention, brand reputation, and, ultimately, revenue.

    Food Scan Genius App Scanner

    Why Legacy APIs (like Edamam/Spoonacular) Slow Down on Complex Allergen Queries

    To understand how to build a fast API, you must first understand why others are slow. The bottleneck for most food APIs, including established players like Spoonacular, isn’t a lack of server power. It’s an architectural problem rooted in legacy database design.

    Consider a common, critical query: “Find all recipes that are gluten-free, dairy-free, low-fodmap, and contain chicken.”

    In a traditional relational database (e.g., PostgreSQL, MySQL), this seemingly simple request triggers a cascade of expensive operations:

    1. Massive JOIN Operations: The system must join the recipes table with the ingredients table, which is then joined with a food_items table, which in turn is joined with multiple allergen_flags and nutrient_profiles tables.
    2. Multi-Column Filtering: The WHERE clause has to filter across these joined tables, scanning millions or even billions of rows to find matches for each condition (gluten-free, dairy-free, etc.).
    3. Computational Complexity: The performance of these operations degrades exponentially as the number of conditions and the size of the dataset grow. The query time becomes unpredictable, swinging from 100ms for a simple lookup to multiple seconds for a complex filter. This is the definition of a non-performant, unscalable system.

    Furthermore, these monolithic architectures are typically hosted in a single geographic region (like AWS us-east-1). A user in Sydney, Australia, making a request to a server in Virginia, USA, is penalized with hundreds of milliseconds of network latency before the database query even begins. This is a losing game from the start.

    This architectural design is the primary reason why optimizing food API performance on these platforms feels like a constant battle against physics. You simply cannot build a globally performant application on top of a regionally-bound, monolithic API.

    How NutriGraphAPI Achieves Sub-150ms Latency (O(1) B-Tree Indexing, Edge Computing)

    We didn’t try to optimize a legacy system. We built a new one from first principles, engineered for a single purpose: delivering food data with predictable, global, sub-150ms latency.

    Here’s how we did it.

    1. Pre-Computed Data & Denormalized Indexing

    Instead of performing expensive JOIN operations on the fly, we do the heavy lifting ahead of time. Our data ingestion pipeline processes and denormalizes nutritional and allergen information into a purpose-built data structure.

    When you query for a “gluten-free, dairy-free” product, we aren’t joining tables. We are performing a lookup on a pre-computed index. We leverage highly optimized B-Tree indexing on composite keys. A B-Tree allows the database to find data without reading the whole table, resulting in O(log n) or, for our most common lookups, effectively O(1) constant time complexity.

    This means our query time remains flat and predictable, whether you’re searching for a single UPC or applying a dozen complex dietary filters. The hard work is already done.

    ScanGeni Ventures Logo

    2. Global Edge Computing

    Our API doesn’t live in a single data center. NutriGraphAPI is deployed as a set of lightweight, stateless functions on a global edge network. When your user in London makes a request, it’s not routed across the Atlantic to Virginia. It’s served by our edge node in London, just a few miles away.

    This single architectural decision eliminates the single largest source of latency: the network round trip. By processing requests at the edge, closer to your users, we can slash network latency from 200-300ms down to 10-20ms.

    When your server response time is 25ms and your network latency is 15ms, you achieve a total response time of 40ms. This is how sub-150ms becomes not just a goal, but a consistent reality.

    Implementing a Redis Cache for Your Barcode Requests

    Even with a sub-150ms API, the fastest API call is the one you don’t have to make. For frequently accessed, non-changing data—like a barcode lookup—implementing a cache on your backend is the single most effective step you can take in optimizing your food API performance and reducing costs.

    A UPC code for a specific brand of peanut butter will always point to the same product data. There is no reason to fetch this from our API every single time a user scans it.

    Redis, an in-memory data store, is the perfect tool for this job. Here is a practical example of implementing a simple Redis cache in your Python backend for barcode lookups.

    import redis
    import requests
    import json
    import os
    
    # Connect to your Redis instance
    # It's best practice to use environment variables for your host, port, and password
    redis_client = redis.Redis(
        host=os.environ.get("REDIS_HOST", "localhost"), 
        port=os.environ.get("REDIS_PORT", 6379), 
        db=0,
        decode_responses=True # Decode responses from bytes to utf-8 strings
    )
    
    NUTRIGRAPH_API_URL = "https://api.nutrigraphapi.com/v1/barcode"
    NUTRIGRAPH_API_KEY = os.environ.get("NUTRIGRAPH_API_KEY")
    
    def get_product_by_barcode(barcode):
        """
        Fetches product data for a given barcode, utilizing a Redis cache.
        """
        cache_key = f"barcode:{barcode}"
    
        # 1. Check the cache first
        try:
            cached_product = redis_client.get(cache_key)
            if cached_product:
                print(f"CACHE HIT for barcode: {barcode}")
                return json.loads(cached_product)
        except redis.exceptions.ConnectionError as e:
            print(f"Redis connection error: {e}. Bypassing cache.")
    
        # 2. Cache miss: Fetch from the NutriGraphAPI
        print(f"CACHE MISS for barcode: {barcode}. Fetching from API.")
        headers = {"x-api-key": NUTRIGRAPH_API_KEY}
        params = {"upc": barcode}
    
        try:
            response = requests.get(NUTRIGRAPH_API_URL, headers=headers, params=params)
            response.raise_for_status() # Raises an HTTPError for bad responses (4xx or 5xx)
            product_data = response.json()
    
            # 3. Store the result in the cache with a Time-To-Live (TTL)
            # Set a TTL of 24 hours (86400 seconds) for product data
            try:
                redis_client.setex(cache_key, 86400, json.dumps(product_data))
            except redis.exceptions.ConnectionError as e:
                print(f"Redis connection error: {e}. Could not write to cache.")
    
            return product_data
    
        except requests.exceptions.RequestException as e:
            print(f"API request failed: {e}")
            return None
    
    # Example Usage
    if __name__ == "__main__":
        # Replace with a real barcode for testing
        sample_barcode = "049000042566"
        product = get_product_by_barcode(sample_barcode)
        if product:
            print(json.dumps(product, indent=2))
    
        # The second call should be a cache hit
        product_again = get_product_by_barcode(sample_barcode)
        if product_again:
            print("\nFetched from cache:", product_again['product_name'])
    

    By implementing this simple caching layer, you can serve a significant percentage of your requests in single-digit milliseconds from your own infrastructure, dramatically improving perceived performance and reducing your API costs.

    Rate Limiting vs. Throttling: How to Scale to 1,000,000 Users Without Breaking the Bank

    As your application grows, managing API consumption becomes critical. Understanding the difference between rate limiting and throttling is key to scaling gracefully and cost-effectively.

    • Rate Limiting is a hard ceiling. It says, “You are allowed 1,000 requests per minute. On the 1,001st request, you will receive a 429 Too Many Requests error.” This is a blunt instrument, essential for preventing abuse (intentional or accidental), but it’s not an elegant way to manage traffic.

    • Throttling is a flow control mechanism. It says, “You have a high volume of requests. I will process them, but I will queue them and handle them at a steady pace to ensure system stability.” It smooths out traffic spikes instead of rejecting them outright.

    Most legacy APIs rely solely on hard rate limits, which can cause service disruptions for your users during a viral traffic spike. If a popular influencer features your app, a sudden flood of new users can hit your rate limit, and suddenly the app stops working for everyone.

    NutriGraphAPI is designed for intelligent scaling. Our system uses a combination of throttling at the edge and fair-use rate limiting. This means we can absorb massive, unexpected traffic spikes without failing. Your application continues to function, and your costs scale predictably with your usage. You aren’t penalized for success.

    Asynchronous vs. Synchronous Fetching for Meal Planning Apps

    Let’s consider a common feature: a meal planner where a user builds their menu for the week. How you fetch the nutritional data for each added recipe is a critical UX decision.

    The Synchronous (Bad) Approach:
    1. User drags a recipe onto their Monday lunch slot.
    2. The UI freezes.
    3. Your app makes an API call to get the nutritional data for that recipe.
    4. Once the API responds, the UI unfreezes and displays the data.

    This creates a jarring, stop-and-start experience. The user feels like they are fighting the interface.

    The Asynchronous (Correct) Approach:
    1. User drags a recipe onto their Monday lunch slot.
    2. The UI updates instantly. The recipe appears in the slot, perhaps with a subtle loading spinner where the calorie count will be.
    3. In the background, your app makes the API call.
    4. When the API responds, the loading spinner is replaced with the nutritional data.

    The user’s workflow is never interrupted. They can continue adding items to their plan while the data is fetched in the background. This feels fluid, responsive, and professional.

    Architecting your front-end to work asynchronously with the API is a hallmark of a high-quality application. It shows you respect the user’s time and are focused on creating a seamless experience. An API built for speed, like NutriGraphAPI, makes this pattern even more effective, as the time between the UI update and the data population becomes nearly imperceptible.


    Optimizing food API performance is not about finding a magic bullet. It is about a series of deliberate, intelligent architectural choices. It’s choosing a provider built on a modern, distributed architecture over a legacy monolith. It’s implementing a smart caching layer for repetitive requests. And it’s designing your own application to work gracefully with asynchronous data.

    Stop letting a slow API dictate the quality of your product and the patience of your users. The difference between a deleted app and a daily habit is measured in milliseconds.

    Don’t take our word for it.

    Test our latency against your current provider at nutrigraphapi.com/pricing.

  • The Complete Guide to Integrating NutriGraphAPI (2026 Developer Tutorial)

    The Complete Guide to Integrating NutriGraphAPI (2026 Developer Tutorial)

    Migrating from an old food API to a modern, 39-label intelligence platform shouldn’t take weeks. We engineered NutriGraphAPI to be fully integrated into your app in less than 48 hours. This isn’t just an upgrade; it’s a fundamental shift in how you handle nutritional data. Legacy APIs give you data. We give you intelligence.

    This guide is for builders. It’s a direct, no-nonsense walkthrough for CTOs and developers who value precision, speed, and elegance in their stack. We’ll move from generating your first key to parsing complex allergen data in minutes. Let’s begin.

    Why we built NutriGraphAPI for developers (Speed, scale, and allergen granularity)

    We didn’t just see a gap in the market; we saw a chasm. We were tired of the slow response times, ambiguous data, and frustrating developer experiences offered by platforms like Spoonacular. They were built for a different era. We built NutriGraphAPI for the applications of tomorrow, founded on three core principles:

    • Speed: Your users won’t wait. Our globally distributed, serverless architecture ensures sub-100ms response times for 99% of queries. Speed isn’t a feature; it’s the foundation.
    • Scale: Whether you’re making 100 calls a day or 10 million, our infrastructure scales with you seamlessly. We handle the complexity so you can focus on building your product, not managing API capacity.
    • Allergen Granularity: The market has moved beyond a simple contains_nuts boolean. Consumers demand nuance. Our proprietary analysis engine provides 39 distinct data labels, from contains_gluten and is_vegan to specific cross-contamination warnings and certifications like kosher and non_gmo. This is the data that builds trust with your users.
    Food Scan Genius App Scanner

    Step 1: Generating your free Sandbox API Key

    Every great integration starts with authentication. We’ve made it frictionless. Our sandbox environment gives you full access to our API structure with a limited dataset of common products. No credit card, no lengthy approval process.

    1. Navigate to nutrigraphapi.com/sandbox.
    2. Enter your email address.
    3. Your API key will be instantly generated and displayed. Store this key securely; you’ll need it for every request.

    Your sandbox key is perfect for development and testing. When you’re ready to go live, you’ll use a production key.

    Step 2: Making your first Barcode Lookup Request

    Let’s get data. The core of NutriGraphAPI is the /v2/lookup endpoint. It accepts a standard UPC or EAN barcode and returns a rich JSON object.

    Here’s how to query for a product using its UPC (049000050103).

    cURL Example

    For a quick test from your terminal:

    curl -X GET 'https://api.nutrigraphapi.com/v2/lookup?upc=049000050103' \
    -H 'x-api-key: YOUR_API_KEY_HERE'
    
    ScanGeni Ventures Logo

    Python Example

    For integration into your application backend:

    import requests
    import json
    
    API_KEY = 'YOUR_API_KEY_HERE'
    BASE_URL = 'https://api.nutrigraphapi.com/v2/lookup'
    UPC_CODE = '049000050103'
    
    headers = {
        'x-api-key': API_KEY
    }
    
    params = {
        'upc': UPC_CODE
    }
    
    response = requests.get(BASE_URL, headers=headers, params=params)
    
    if response.status_code == 200:
        product_data = response.json()
        print(json.dumps(product_data, indent=2))
    else:
        print(f"Error: {response.status_code}")
        print(response.text)
    

    Execute this, and you’ll receive a detailed JSON payload. That’s your first taste of the platform’s power.

    Step 3: Parsing the analysed_data JSON response block

    This is where NutriGraphAPI separates itself. The data you receive isn’t a flat, messy structure. It’s a clean, deeply nested object designed for easy parsing. The most valuable information lives inside the analysed_data block.

    Sample JSON Response

    Here is a truncated example of what the API returns:

    {
      "status": "success",
      "upc": "049000050103",
      "product_name": "A&W Root Beer",
      "brand": "A&W",
      "analysed_data": {
        "nutrition_facts": {
          "calories": 170,
          "fat": {
            "total_g": 0,
            "saturated_g": 0
          },
          "sugars": {
            "total_g": 47,
            "added_g": 47
          }
        },
        "allergen_profile": {
          "contains_gluten": false,
          "contains_dairy": false,
          "contains_nuts": false,
          "cross_contamination_risk": []
        },
        "dietary_labels": {
          "is_vegan": true,
          "is_vegetarian": true,
          "is_kosher": true,
          "is_halal": false
        }
      }
    }
    

    Extracting the 39 Labels

    With this structure, accessing the specific data points your application needs is trivial. Let’s build on our previous Python script to extract key information.

    # Assuming 'product_data' is the JSON object from the previous step
    
    analysed_data = product_data.get('analysed_data', {})
    
    # Extracting nutritional information
    nutrition = analysed_data.get('nutrition_facts', {})
    calories = nutrition.get('calories')
    total_sugars = nutrition.get('sugars', {}).get('total_g')
    
    # Extracting allergen information
    allergens = analysed_data.get('allergen_profile', {})
    is_gluten_free = not allergens.get('contains_gluten', True)
    
    # Extracting dietary labels
    dietary = analysed_data.get('dietary_labels', {})
    is_vegan = dietary.get('is_vegan')
    
    print(f"Product: {product_data.get('product_name')}")
    print(f"Calories: {calories}")
    print(f"Total Sugars: {total_sugars}g")
    print(f"Is Gluten-Free: {is_gluten_free}")
    print(f"Is Vegan: {is_vegan}")
    

    This clean, predictable access to 39 distinct labels is what allows you to build sophisticated features—like advanced dietary filters or allergen warnings—that your competitors simply can’t match.

    Step 4: Handling Webhooks and Rate Limits in Production

    Moving from the sandbox to production means thinking about scale and resilience. We provide the tools to do this gracefully.

    Rate Limits: Your production key comes with a generous rate limit. We communicate your current status via HTTP headers in every response:

    • X-RateLimit-Limit: The total number of requests allowed in the current window.
    • X-RateLimit-Remaining: The number of requests you have left.
    • X-RateLimit-Reset: The UTC timestamp when the limit resets.

    Monitor these headers. If you approach the limit, implement a gentle exponential backoff strategy in your client to avoid 429 Too Many Requests errors.

    Webhooks: For high-volume or non-time-sensitive tasks, like analyzing a newly submitted product catalog, direct API calls can be inefficient. For these use cases, we support webhooks. You can submit a batch of UPCs to our /v2/batch-process endpoint, provide a callback URL, and our system will process them asynchronously, sending you a POST request with the results for each item as it’s completed. This is the professional way to handle large-scale data ingestion.

    Best practices for caching NutriGraph data on your local server

    Don’t pay for the same answer twice. The nutritional data for a given barcode is relatively static. Caching responses is not just allowed; it’s encouraged. It reduces latency for your users and lowers your API call volume.

    We recommend a simple key-value store like Redis or Memcached.

    1. Cache Key: Use the UPC or EAN barcode as the cache key (e.g., ng_cache:049000050103).
    2. Cache Value: Store the entire JSON response object as a string.
    3. Set a TTL (Time-To-Live): A 24-hour to 7-day TTL is a sensible starting point. Product formulations can change, so you don’t want to cache data indefinitely.

    Pseudocode for a Cached Request

    function getProductData(upc) {
      cached_data = redis.get(f"ng_cache:{upc}");
    
      if (cached_data) {
        return JSON.parse(cached_data);
      } else {
        api_response = nutrigraph_api.lookup(upc);
        redis.set(f"ng_cache:{upc}", JSON.stringify(api_response), ttl=86400); // 24-hour TTL
        return api_response;
      }
    }
    

    This simple logic drastically improves your application’s performance and efficiency.


    In less than an hour, you’ve gone from a blank slate to a functioning integration pulling rich, structured nutritional data. You’ve seen the speed, the granularity, and the thoughtful design that sets NutriGraphAPI apart. The next 47 hours are for scaling.

    Ready to build?

    Pull a 1,000-call developer key at nutrigraphapi.com/pricing.

  • Best Food APIs for Developers in 2026: Edamam vs Spoonacular vs Nutritionix vs NutriGraphAPI

    Best Food APIs for Developers in 2026: Edamam vs Spoonacular vs Nutritionix vs NutriGraphAPI

    The Conversation About Food Data is Stale. Let’s Change It.

    There’s a moment in every ambitious project where you hit a wall. For developers and founders in the health-tech space, that wall is often made of data. You have a vision for a truly personalized, clinically-aware, and deeply insightful nutrition application. You go looking for the right tool, the right data source, and what do you find? A landscape of compromises.

    You find APIs that treat ‘allergens’ as a simple boolean. You find databases that are a mile wide and an inch deep, cobbled together from user-submitted data with the consistency of a potluck dinner. You’re forced to choose between a recipe parser and granular ingredient analysis, but you can’t have both. You’re building a rocket ship, and you’re being handed a wrench from a 1970s toolkit.

    This isn’t just a technical problem; it’s a failure of imagination. The current crop of food APIs—Spoonacular, Edamam, Nutritionix—are products of a bygone era. They were built to answer a simple question: “What’s in this food?” They were never designed to answer the questions that matter now: “Is this food truly safe for me? Is it aligned with my specific health protocol? Will it cause an inflammatory response? Is it ‘clean’?”

    If you’re tired of building your future on a foundation of ‘good enough,’ you’re in the right place. This isn’t another superficial listicle. This is a brutally honest, technically-grounded teardown of the best food APIs for developers in 2026. We’ll dissect the major players, expose their limitations, and show you what becomes possible when you stop thinking about food data and start demanding food intelligence.


    Food Scan Genius App Scanner

    What to Look For in a Food Data API: The CTO’s Checklist

    Choosing a food data API isn’t just a line item on your budget; it’s a foundational architectural decision. Your data partner dictates your product roadmap, your user’s trust, and your ability to create a defensible moat around your business. Before we compare names, let’s agree on the criteria that separate a utility from a strategic asset.

    1. Data Granularity & Attribute Depth:
    This is the most critical factor. Basic APIs provide macros (fat, protein, carbs), a handful of micros, and maybe a top-level allergen warning. This is table stakes. A modern, intelligent API must provide an order of magnitude more depth.

    • Allergen Granularity: Does it just flag ‘nuts,’ or does it differentiate between peanuts, tree nuts, and specific sub-allergens? Does it track the EU 14, the FDA 9, or a more comprehensive, global list? Does it account for cross-contamination warnings (‘may contain’)?
    • Dietary & Lifestyle Attributes: How deep does it go beyond ‘vegan’ or ‘gluten-free’? Can it identify Paleo, Keto, Low-FODMAP, or AIP-compliant products? What about religious compliance like Kosher, Halal, or Jain?
    • Ingredient Intelligence: Does the API simply list ingredients, or does it analyze them? Can it flag artificial sweeteners, preservatives, inflammatory oils, or other additives that fall under the ‘clean label’ umbrella?

    2. Data Sourcing & Accuracy:
    Where does the data come from? An API is only as good as its source of truth. Many popular APIs rely heavily on crowd-sourcing or scraping, leading to a high signal-to-noise ratio, outdated information, and a lack of accountability. Look for providers who source data directly from manufacturers, employ rigorous verification processes, and can stand behind their data’s accuracy. Your liability as a health-tech company depends on it.

    3. API Performance & Developer Experience:
    * Response Time (Latency): In a mobile-first world, every millisecond counts. An API that takes 500ms+ to respond will kill your user experience. Demand latency under 100ms for core lookups.
    * Scalability & Rate Limits: Will the API grow with you? Are the rate limits generous and the overage policies clear? You don’t want your growth to be throttled by your data provider’s infrastructure.
    * Documentation & SDKs: Is the documentation clear, comprehensive, and filled with real-world examples? Are there SDKs for your preferred language? A great developer experience accelerates your time-to-market.

    4. The Pricing Model:
    It’s not just about the cost per call. It’s about value and predictability.

    • Per-Call vs. Tiered: Does the model punish you for scaling? Are there massive jumps between tiers?
    • Transparency: Are enterprise plans a black box requiring endless sales calls? Or is the pricing clear and upfront?
    • Value: What is the cost per attribute? An API that charges $0.01 per call for 20 data points is exponentially more expensive than one that charges $0.02 for 200+ data points. You’re not buying calls; you’re buying answers.

    With this framework in mind, let’s put the industry’s biggest names under the microscope.


    Spoonacular: The Crowd-Sourced Behemoth

    Spoonacular is often the first stop for developers. It’s massive. With over 2 million recipes and 500,000+ CPG products, its scale is impressive. But this scale is its greatest strength and its most profound weakness.

    Strengths:
    * Vast Recipe Database: If your primary use case is recipe search, parsing, and discovery, Spoonacular is a functional starting point. Its recipe parsing and meal planning endpoints are mature.
    * Broad Feature Set: It tries to be everything to everyone, with endpoints for recipe generation, menu planning, wine pairing, and more. It’s a Swiss Army knife.

    Limitations:
    * Data Quality is a Gamble: Much of Spoonacular’s data is user-generated or scraped. This means you’ll find inconsistencies, inaccuracies, and outdated information. For a consumer recipe blog, this might be acceptable. For a health-tech app managing a user’s severe peanut allergy, it’s a lawsuit waiting to happen.
    * Shallow Nutritional Depth: Beyond basic macros and a few vitamins, the data is thin. Its allergen detection is rudimentary, often a simple boolean flag, lacking the granularity to distinguish between ‘contains’ and ‘may contain.’
    * Slow Response Times: The ‘everything but the kitchen sink’ approach leads to a complex, monolithic API. It’s not uncommon to see response times exceeding 500ms, especially for complex queries. This is a UX killer.
    * The Swiss Army Knife Problem: While it does many things, it excels at none of them. The product data is less reliable than dedicated CPG APIs, and the nutritional analysis is less rigorous than clinical-grade alternatives.

    Pricing:
    Spoonacular uses a points-based system that can be confusing. Different endpoints cost different numbers of points. It’s a classic freemium model designed to get you hooked on the free plan and then upsell you to paid tiers that can quickly become expensive as you scale. Their enterprise pricing is opaque.

    Verdict: A good tool for hobby projects, recipe bloggers, or applications where data accuracy is not mission-critical. It’s a jack-of-all-trades, master of none. If you’re building a serious health or wellness application, relying on Spoonacular’s data is like building on sand.


    Edamam: The Recipe & NLP Specialist

    Edamam has carved out a strong niche with its powerful Natural Language Processing (NLP) and recipe analysis capabilities. It’s trusted by major brands and has a reputation for quality in its specific domain.

    Strengths:
    * Best-in-Class NLP: Edamam’s Nutrition Analysis API is excellent at taking a raw ingredient list (e.g., “a cup of flour, two large eggs, and a dash of vanilla”) and returning detailed nutritional information. This is its core competency.
    * Solid Recipe Database: Its recipe search API is well-structured and provides reliable data for a large corpus of recipes.
    * Established & Trusted: They’ve been around for a while and power some big names, which provides a degree of trust and stability.

    Limitations:
    * Limited CPG/Barcode Coverage: While strong on recipes, Edamam’s database of branded, packaged food products (accessed via UPC) is significantly smaller than its competitors. If your app relies on barcode scanning, this is a major gap.
    * Surface-Level Allergen & Dietary Data: Similar to Spoonacular, the depth is lacking. It provides standard health labels (‘Vegan’, ‘Paleo’) and allergen information that covers the basics but lacks the deep granularity needed for complex dietary management. Concepts like ‘clean label’ or advanced inflammatory triggers are not part of their data model.
    * Pricing Model Punishes Data Depth: Edamam’s pricing is often tied to the number of nutrients you request per food. Want more than the basic macros? The cost per call goes up. This model actively discourages developers from building data-rich experiences.

    Pricing:
    Edamam offers several APIs (Recipe Search, Nutrition Analysis, etc.) each with its own pricing structure. Tiers are based on API calls per month, with significant overage charges. The model that charges per nutrient can make cost forecasting difficult and expensive.

    Verdict: If your application’s core function is analyzing user-submitted recipes or unstructured ingredient lists, Edamam is a strong contender. However, for applications focused on CPG product data, barcode scanning, and deep dietary intelligence, its limitations become apparent very quickly.


    ScanGeni Ventures Logo

    Nutritionix: The Food Service & Restaurant Expert

    Nutritionix began with a focus on restaurant and food service data, and this remains its core strength. Their NLP is tuned for restaurant menu items and they boast a massive database of what you’ll find when eating out.

    Strengths:
    * Unmatched Restaurant Database: They have nutritional information for close to a million restaurant menu items. If your app is a calorie or macro tracker for people who eat out frequently, Nutritionix is hard to beat.
    * Strong Natural Language API: Their NLP is excellent for queries like “a large coffee with cream and two sugars at Starbucks” or “a Big Mac combo.”
    * Trusted by Major Brands: Like Edamam, they have a strong enterprise client list, particularly in the corporate wellness and restaurant space.

    Limitations:
    * Weaker on CPG/Grocery Data: While they have a CPG database, it’s not their primary focus. The depth and verification process can’t match a provider that is singularly focused on grocery products.
    * Dated Data Model: The API primarily serves up basic nutrition facts panel data. It lacks the rich, modern attributes that users now demand: clean label scoring, detailed allergen sub-classes, sustainability scores, or religious compliance.
    * Enterprise-Focused: The platform and pricing feel heavily geared towards large enterprise clients. For startups and mid-size companies, navigating their offerings and getting support can be more challenging compared to more developer-centric platforms.

    Pricing:
    Nutritionix has a free starter plan, but its paid plans ramp up quickly and are clearly aimed at large-scale B2B customers. Getting a quote for high-volume usage requires a conversation with their sales team.

    Verdict: The go-to choice for applications centered on dining out and restaurant food tracking. For health-tech companies building next-generation grocery shopping, meal planning, or clinical nutrition apps, Nutritionix’s data model feels a decade old.


    Open Food Facts: When Free is Fine (And When It’s a Liability)

    We have to mention Open Food Facts. It’s an open-source, crowd-sourced database, and it’s free. For students, hackathons, or non-commercial projects, it’s a fantastic resource.

    When It’s Fine:
    * Building a personal project or a proof-of-concept.
    * When 100% data accuracy is not a requirement.
    * When your budget is zero and you have the developer resources to clean and validate the data yourself.

    When It’s Not:
    * Commercial Applications: Relying on unverified, crowd-sourced data for a commercial product is a massive business risk. What happens when a user with a celiac diagnosis scans a product that was incorrectly tagged as gluten-free by a random contributor?
    * Data Consistency: The data is notoriously inconsistent. Some products have rich data, others have nothing but a name. There’s no SLA, no one to call when the data is wrong, and no guarantee of uptime.
    * Lack of Depth: While it has some interesting fields like the Nutri-Score, it lacks the structured, deep attributes of a commercial-grade API.

    Verdict: A valuable community project and a great starting point for exploration. But for any business that takes its users’ health seriously, building on Open Food Facts is like building a hospital on a volunteer-run foundation. It’s a question of ‘when,’ not ‘if,’ it will fail you.


    NutriGraphAPI: Where 200+ Attributes Changes What’s Possible

    This brings us to a different way of thinking. NutriGraphAPI was built on a simple, powerful premise: the old model of food data is broken. A modern nutrition app doesn’t need a list of 20 nutrients; it needs a comprehensive, verified, and deeply interconnected graph of food intelligence. It needs to understand food the way a clinical nutritionist does.

    We didn’t build another food data API. We built a food intelligence platform. The difference is in the depth.

    Where We Are Radically Different:
    * Unrivaled Granularity (200+ Attributes Per Product): This is our foundation. We don’t just track the basics. We track 39+ allergens and sub-allergens, including cross-contamination risks. We score products for compliance with 20+ diets (Keto, Paleo, Low-FODMAP, AIP, etc.). We analyze every single ingredient to assign quality scores and flag over 100 additives, preservatives, inflammatory agents, and more.
    * Clean Label & Quality Scoring: We’re the only API that provides objective, algorithm-driven ‘Clean Label’ and ‘Food Quality’ scores. This allows you to move beyond calories and empower users to understand how a food is made, not just what’s in it.
    * Source of Truth: Our data isn’t scraped or crowd-sourced. We have a multi-layered verification process that starts with manufacturer-submitted data and is enriched by a team of nutritionists and data scientists. We stand behind our data because we own the entire pipeline.
    * Blazing Fast Performance: Our API is built on a modern, multi-cloud infrastructure designed for speed and scale. Our median response time is under 75ms, ensuring a fluid and responsive user experience in your application.
    * Religious Dietary Compliance: We provide detailed compliance data for Halal, Kosher, Jain, and Hindu (Vegetarian/Lacto-Vegetarian) diets, opening up new markets and use cases that are impossible with other providers.

    What This Unlocks for You:
    * For the CTO: You’re building on a reliable, scalable, and future-proof platform. You reduce technical debt by eliminating the need to build your own complex data cleaning and analysis pipelines. Our rich dataset allows your team to build features your competitors can’t even conceive of.
    * For the Lead Developer: You get a clean, well-documented REST API, predictable performance, and data that is structured, consistent, and immediately usable. No more endless data cleaning scripts. You can focus on building features, not wrestling with bad data.
    * For the Founder: You create a defensible moat. While your competitors are still arguing about basic macros, you can offer users truly personalized insights: “Here are 5 snack bars that are not only gluten-free, but also free from inflammatory seed oils and compliant with your Paleo lifestyle.” You reduce liability, increase user trust, and build a product people will pay for.


    The Ultimate Comparison Table: Data vs. Intelligence

    Let’s put it all on the table. No marketing spin, just the facts.

    Feature Spoonacular Edamam Nutritionix NutriGraphAPI
    Core Strength Recipe Database Recipe NLP Restaurant Data CPG Product Intelligence
    Allergen Fields Basic (e.g., ‘contains peanuts’) Basic (FDA/EU list) Basic 39+ Allergens & Cross-Contamination
    Dietary Tags ~10 common diets (Vegan, Gluten-Free) ~15 common diets Very limited 20+ Diets (Keto, Paleo, FODMAP, AIP, etc.)
    Religious Compliance ❌ No ❌ No ❌ No ✅ Halal, Kosher, Jain, Hindu
    Clean Label Analysis ❌ No ❌ No ❌ No ✅ Flags 100+ additives, preservatives, seed oils
    Objective Quality Score ❌ No ❌ No ❌ No ✅ Proprietary Food Quality Score
    Data Source Crowd-sourced, Scraped Partnered, Scraped Food Service, Partnered Direct from Manufacturer, Human-Verified
    Barcode/UPC Lookup ✅ (Variable Quality) ⚠️ (Limited Database) ✅ (Restaurant-focused) ✅ (Comprehensive & Verified)
    Median Response Time ~400-600ms ~250-400ms ~300-500ms <75ms
    Pricing Model Confusing points system Per-call, per-nutrient Opaque Enterprise Tiers Transparent, Value-based Tiers

    Which API Is Right for Your Use Case?

    Choosing the right tool for the job is everything.

    • If you’re building a simple recipe blog or a hobbyist calorie counter…
      Spoonacular or even Open Food Facts might be sufficient. Your need for data accuracy and depth is low, and you can tolerate inconsistencies.

    • If your app’s main feature is analyzing user-submitted recipe text…
      Edamam’s NLP is purpose-built for this and is likely your best choice.

    • If you’re building a tool to track calories while dining out…
      Nutritionix has the most comprehensive database of restaurant menu items and is the clear leader here.

    • If you are building a next-generation health-tech platform, a clinical nutrition app, a personalized grocery shopping guide, an allergy management tool, or any application where data accuracy, depth, and user trust are paramount…
      The choice is clear. The limitations of the other APIs become liabilities. You need the granular, verified, and intelligent data that only NutriGraphAPI provides. You’re not just logging food; you’re changing lives. You need a partner whose data is as serious as your mission.


    Stop Compromising. Start Building.

    The health-tech landscape is littered with apps that look the same because they’re all built on the same limited data. You have an opportunity to build something different. Something smarter. Something that creates real, lasting value for your users.

    But you can’t build the future on yesterday’s tools.

    It’s time to demand more from your data. See for yourself what’s possible when you have access to a true food intelligence platform.

    See how NutriGraphAPI stacks up on price and pull your Free 1,000-Call Sandbox Key.

  • Designing for Clean Label Data & API Integration

    Designing for Clean Label Data & API Integration

    What Is Clean Label Food? A Developer’s Guide

    There are moments in the market when a phrase captures the public imagination so completely it becomes a movement. It’s not a feature, it’s a feeling. ‘Clean label’ is one of those moments. Consumers are demanding it, CPG brands are spending billions to chase it, and your users expect you to understand it.

    But what is it, really?

    Here’s the problem, the one that keeps your data science team up at night: ‘Clean label’ has no single, legally-binding definition from the FDA or USDA. It’s a mosaic of consumer perceptions, marketing claims, and loosely-defined attributes. For a CTO or a Lead Developer, this ambiguity is a liability. You can’t build a reliable feature on a feeling. You can’t query a database for a marketing term.

    Trying to programmatically score a product’s ‘cleanliness’ using simple keyword matching or regex on an ingredient list is a fool’s errand. You’ll miss nuanced chemical names, misinterpret processing methods, and ultimately, deliver a brittle, inaccurate feature that erodes user trust. Your competitor, Spoonacular API, might give you a boolean flag, but the modern consumer—and the modern developer—requires more depth. They require mathematical certainty.

    This is not a simple data problem. It’s a complex, multi-faceted challenge of data aggregation, ontological mapping, and algorithmic scoring. This guide will walk you through the chaos and show you how to architect a solution. We’ll define the core components of the ‘clean label’ concept and then provide a clear, actionable tutorial on how to implement a robust, quantitative clean label scoring system using a purpose-built API.


    Food Scan Genius App Scanner

    Clean Label Definition: What Consumers and Regulators Mean

    To build a system that can score ‘clean label’, you must first understand the disparate sources that define it. The definition is a consensus, not a decree.

    For the Consumer:

    When a consumer looks for a ‘clean label’, they are primarily driven by two things: comprehensibility and a perceived lack of artificiality. They are looking for a short, simple ingredient list they can understand. If they can’t pronounce it, or if it sounds like it was made in a lab, they become suspicious. Their mental model equates ‘clean’ with:

    • Familiar Ingredients: Things they might find in their own kitchen (e.g., ‘flour’, ‘sugar’, ‘rosemary extract’).
    • Short Ingredient Lists: The belief that fewer ingredients correlate with less processing and fewer additives.
    • Absence of Negatives: They are scanning for what isn’t there—no artificial colors, no high-fructose corn syrup, no preservatives.
    • Transparency: They want to know where the food came from (origin) and how it was made (processing).

    For the Regulator (and the Lack Thereof):

    The regulatory landscape is fragmented. Unlike the term ‘Organic’, which is rigorously controlled by the USDA’s National Organic Program, ‘clean label’ lives in a gray area.

    • FDA & USDA: Neither agency has a formal definition for ‘clean label’. They regulate individual components—like the definition of ‘healthy’ or rules around specific additives—but not the overarching concept.
    • ‘Natural’: The closest regulated term is ‘natural’. The FDA has a long-standing but informal policy that ‘natural’ means nothing artificial or synthetic (including all color additives regardless of source) has been included in, or has been added to, a food that would not normally be expected to be in that food. However, this policy is not legally enforceable in the same way ‘organic’ is and doesn’t cover production methods like pasteurization or manufacturing processes.

    This regulatory vacuum is precisely why a programmatic, data-driven approach is essential. A simple is_natural flag is insufficient. You need a system that can analyze ingredients, certifications, and processing methods against a weighted, multi-factor model. You need to build your own source of truth.


    The 5 Categories of Clean Label Attributes

    To turn the abstract concept of ‘clean label’ into a quantifiable metric, we must break it down into logical, analyzable categories. At NutriGraph, our data ontology is built around five core pillars. Any robust clean label scoring algorithm you build must account for these distinct vectors.

    1. No Artificial Additives

    This is the cornerstone of the clean label movement. It refers to the absence of synthetic ingredients created in a laboratory. Programmatically identifying these requires a comprehensive, constantly updated database of additives, mapped to their function and origin.

    • Artificial Colors: e.g., Red No. 40, Yellow No. 5. These are often the first things consumers look to avoid.
    • Artificial Flavors: e.g., Vanillin (synthetic version of vanilla). The challenge here is that ingredient lists often just state ‘Artificial Flavors’. Your system needs to penalize this lack of transparency.
    • Artificial Sweeteners: e.g., Aspartame, Sucralose, Acesulfame Potassium. These are highly controversial among health-conscious consumers.
    ScanGeni Ventures Logo

    2. No Preservatives

    Preservatives extend shelf life, but many consumers view them as unnatural. Differentiating between natural and artificial preservatives is a key technical challenge.

    • Artificial Preservatives: e.g., Butylated Hydroxyanisole (BHA), Sodium Benzoate, Potassium Sorbate.
    • Natural Preservatives: e.g., Ascorbic Acid (Vitamin C), Tocopherols (Vitamin E), Rosemary Extract. A sophisticated scoring system should be able to identify these and penalize them less severely, or not at all.

    3. Non-GMO

    Genetically Modified Organisms (GMOs) are a major concern for a large segment of the clean label audience. Verification is key.

    • Certification-Based: The most reliable method is to check for third-party certifications like the ‘Non-GMO Project Verified’ seal.
    • Ingredient-Based Inference: In the absence of a certification, an algorithm can infer the likelihood of GMO presence. Ingredients like corn, soy, canola, and sugar beets sourced from North America have a high probability of being genetically modified unless explicitly stated otherwise. Your data model must account for this probabilistic risk.

    4. Organic

    While distinct from ‘clean label’, the ‘USDA Organic’ certification is a powerful proxy. It’s a legally-enforced standard that inherently covers many clean label attributes.

    • Pesticide & Herbicide Avoidance: Organic standards strictly limit the use of synthetic pesticides and herbicides.
    • Non-GMO: Organic products are, by definition, non-GMO.
    • Restrictions on Artificial Additives: The National List of Allowed and Prohibited Substances restricts many of the artificial ingredients that clean label consumers avoid.

    5. Minimal Processing

    This is perhaps the most difficult attribute to score programmatically, as it’s not always evident from the ingredient list alone. It refers to foods that are as close to their natural state as possible.

    • Processing Indicators: Look for terms like ‘hydrogenated’, ‘interesterified’, ‘hydrolyzed’, or ‘ultra-pasteurized’. These indicate high levels of industrial processing.
    • Ingredient Form: ‘Whole wheat flour’ is less processed than ‘enriched bleached flour’. ‘Chicken’ is less processed than ‘mechanically separated chicken’. Your system needs the granularity to understand these differences.
    • Ingredient Count: While not a perfect metric, a very long and complex ingredient list is often a strong indicator of a highly processed product.

    How Clean Label is Scored Programmatically (NutriGraphAPI’s Clean Label Score + Transparency Index)

    Answering ‘what is clean label food’ for a consumer is one thing. Building a scalable, reliable feature for a health-tech application is an entirely different class of problem. You cannot rely on a series of if/else statements. You need a scoring engine.

    At NutriGraphAPI, we’ve engineered a solution to this ambiguity. We treat ‘clean label’ not as a binary state, but as a calculated score on a spectrum. Our approach is built on two proprietary metrics returned for every product in our database:

    1. clean_label_score (0-100): This is the core quantitative metric. It’s a weighted algorithm that synthesizes the five categories discussed above into a single, easy-to-understand score.
      • Negative Modifiers: The presence of artificial additives, preservatives, high-risk GMO ingredients, and indicators of heavy processing applies negative modifiers to the score.
      • Positive Modifiers: The presence of a ‘USDA Organic’ or ‘Non-GMO Project Verified’ certification applies a significant positive modifier.
      • Intelligent Weighting: Our algorithm understands that consumers weigh ‘no artificial colors’ more heavily than the presence of a natural preservative like ‘vinegar’. The weighting is based on massive consumer survey data and food science expertise.
    2. transparency_index (0-100): A high score is useless without confidence in the underlying data. This is where other APIs fail. The Transparency Index measures the quality and completeness of the data available for a given product. This allows you, the developer, to understand the certainty behind the score.
      • Data Sources: Does the data come directly from the manufacturer, or is it scraped and unverified? A direct feed increases the index.
      • Ingredient Specificity: Does the label say ‘spices’ or does it list ‘cumin, paprika, chili powder’? Does it say ‘natural flavors’ without elaboration? Vagueness is penalized.
      • Certification Verification: Is the organic certification verified and up-to-date? We programmatically check certification databases, and a successful match boosts the index.

    By providing both a clean_label_score and a transparency_index, we give you the power to not only show a score but also to explain why the score is what it is. For a developer, this is control. For a user, this is trust.


    What a 95/100 Clean Label Score Actually Means

    A number is just a number until you see the data behind it. Let’s deconstruct a raw JSON response from the NutriGraphAPI for a hypothetical product—’Simple Harvest Organic Lentil Soup’—that scores a 95.

    When you query our API for this product’s UPC, you receive a rich data object. The clean_label block provides the final scores, but the real power lies in the analysed_data block, which shows our work.

    {
      "product_id": "UPC_012345678901",
      "product_name": "Simple Harvest Organic Lentil Soup",
      "clean_label": {
        "score": 95,
        "transparency_index": 98,
        "summary_tags": ["USDA Organic", "Non-GMO Verified", "No Artificial Additives"]
      },
      "analysed_data": {
        "ingredient_analysis": {
          "total_ingredients": 11,
          "positive_indicators": [
            {"ingredient": "Organic Carrots", "reason": "Certified Organic"},
            {"ingredient": "Organic Lentils", "reason": "Certified Organic"},
            {"ingredient": "Sea Salt", "reason": "Minimally processed mineral"},
            {"ingredient": "Rosemary Extract", "reason": "Natural preservative, not penalized"}
          ],
          "negative_indicators": [
            {
              "ingredient": "Natural Flavors",
              "reason": "Ambiguous term, minor penalty to transparency index",
              "score_impact": -2
            }
          ]
        },
        "additive_analysis": {
          "has_artificial_colors": false,
          "has_artificial_flavors": false,
          "has_artificial_sweeteners": false,
          "has_synthetic_preservatives": false
        },
        "certification_analysis": {
          "usda_organic": {
            "is_certified": true,
            "level": "Certified Organic",
            "score_impact": +20
          },
          "non_gmo_project": {
            "is_certified": true,
            "score_impact": +10
          }
        },
        "processing_analysis": {
          "level": "Minimally Processed",
          "indicators_found": ["Canning"],
          "score_impact": -3
        }
      }
    }
    

    Deconstructing the Score:

    • Base Score: The product starts with a high base score due to its simple nature.
    • certification_analysis: The USDA Organic and Non-GMO Project certifications provide a massive +30 point boost. This is the primary driver of the high score.
    • additive_analysis: The clean sweep of false values for all artificial additive categories prevents any major deductions.
    • processing_analysis: We identify ‘Canning’ as a processing method. It’s a necessary step for shelf-stability but still a form of processing, so it incurs a small -3 point deduction.
    • ingredient_analysis: The term ‘Natural Flavors’ is a red flag for transparency. While not ‘artificial’, its vagueness is penalized. It reduces the final score by -2 points and slightly lowers the transparency_index.

    The Result: A 95. This isn’t a magic number. It’s the calculated result of a transparent, multi-factor analysis. You can now confidently display this score in your application, and if a user asks why, you have the granular data in the analysed_data block to create a detailed breakdown. This level of detail is how you build an unassailable, data-driven feature.


    How to Filter Products by Clean Label Status in Your App

    Displaying a score is useful, but the real power comes from enabling your users to discover products that meet their standards. This means implementing server-side filtering based on the clean_label_score.

    The NutriGraphAPI /products/search endpoint is designed for this. You can pass the clean_label_score as a query parameter to filter results in real-time.

    Let’s say you want to build a feature that allows users to find all ‘soups’ with a clean label score of 90 or higher. Your API call would look like this:

    # cURL example for finding products with a high clean label score
    
    curl -X GET 'https://api.nutrigraphapi.com/v2/products/search' \
    -H 'x-api-key: YOUR_API_KEY' \
    -H 'Content-Type: application/json' \
    -d '{
      "query": "soup",
      "filters": {
        "clean_label_score": {
          "min": 90,
          "max": 100
        },
        "transparency_index": {
            "min": 75
        }
      },
      "pageSize": 25
    }'
    

    Code Breakdown:

    • Endpoint: We use the /products/search endpoint, which is optimized for complex queries.
    • query: The user’s basic search term, in this case, ‘soup’.
    • filters object: This is where the magic happens.
      • clean_label_score: We’re specifying a min value of 90. This tells the API to only return products that meet this high threshold.
      • transparency_index: We’ve also added a minimum transparency_index of 75. This is a crucial best practice. It ensures that the high scores you get back are based on reliable, high-quality data, preventing false positives from products with incomplete information.

    By integrating this type of query into your application’s backend, you can move beyond simple text search and offer sophisticated, value-driven discovery features like ‘Shop Cleanest Snacks’ or a ‘Clean Eating’ filter that actually means something.


    Clean Label vs Organic vs Natural: The Differences Developers Need to Know

    These terms are often used interchangeably in marketing, but in a data model, they are distinct entities with different levels of technical validation. Conflating them in your backend logic will lead to inaccurate results.

    Attribute Clean Label Organic (USDA) Natural (FDA)
    Definition Consumer-driven concept. No legal definition. Focuses on simple ingredients and minimal processing. Legally-enforced federal standard governed by the USDA’s NOP. Vague FDA policy. No artificial or synthetic substances. Does not cover production or processing.
    Data Type Calculated Score (0-100). A composite metric derived from multiple data points (ingredients, certifications, etc.). Boolean + String. is_organic: true, organic_level: "Certified Organic". A verifiable, binary state based on certification. Boolean (Inferred). is_natural: true. A less reliable flag, inferred from the absence of known artificial ingredients. High potential for false positives.
    Technical Validation High. Requires a complex algorithm and a rich dataset. The transparency_index is key to assessing confidence. Very High. Can be programmatically validated against official USDA databases of certified operators. Low. Cannot be definitively proven, only inferred. High-risk for building user-facing features.
    API Implementation Filter by a numerical range: clean_label_score > 90. Offers granular control for ‘good, better, best’ tiers. Filter by a boolean flag: is_organic=true. Simple and reliable for filtering. Use with caution. Best used as a supplementary tag, not a primary filter, due to its ambiguity.

    The takeaway for a developer is this: Don’t treat these as synonyms. ‘Organic’ is a verifiable certification and should be stored as a distinct boolean field. ‘Natural’ is a weak signal, a marketing claim that should be handled with skepticism. ‘Clean Label’ is the master concept—a calculated, nuanced score that, when done right, can encompass the signals from ‘organic’ and ‘natural’ while adding its own layers of intelligence about processing and additives. A well-architected system ingests the verifiable data (like certifications) to calculate the more abstract, valuable metric (the clean label score).


    Your users are swimming in a sea of marketing jargon. They’re looking for an application that can give them clarity and confidence in their choices. Simple tools that scrape ingredient lists are not enough. They provide the illusion of data without the substance of intelligence.

    To win, you need to provide a definitive answer to the question, ‘What is clean label food?’ not just in a blog post, but in the very architecture of your product. You need a system that can quantify ambiguity and turn a consumer trend into a reliable, scalable, and powerful feature.

    We’ve built the engine. The next step is yours.

    Explore NutriGraphAPI’s clean label schema and test the 1,000-call Sandbox. See the data for yourself at nutrigraphapi.com/docs.


  • What Is Clean Label Food? A Developer’s Guide to Clean Label Data & API Integration

    What Is Clean Label Food? A Developer’s Guide to Clean Label Data & API Integration

    Your App’s Next Competitive Advantage

    CTOs and product leaders in the health-tech space know that data is the bedrock of any meaningful user experience. You’ve likely already solved for the essentials. Your application probably has robust nutritional data, calorie counts, and—critically—allergen detection. These are table stakes, the non-negotiable features required to even compete. Filtering out peanuts, gluten, or dairy isn’t a feature anymore; it’s an expectation.

    But once you’ve told a user what they can’t eat, how do you help them decide what they should eat? How do you build a product that doesn’t just prevent negative outcomes but actively guides users toward positive ones? The answer isn’t just in more data, but in smarter data.

    The next frontier, the feature that will differentiate your platform and build deep, lasting user trust, is understanding and operationalizing a concept that dominates consumer food trends: Clean Label.

    This is where the market is going. Consumers are no longer just avoiding specific allergens; they are actively seeking out products with short, simple, and understandable ingredient lists. They want food that is ‘clean.’ The problem? ‘Clean’ is an ambiguous, marketing-driven term without a strict legal or regulatory definition. For a developer, ambiguity is the enemy. How do you write a function for a feeling? How do you query a database for a concept?

    This is the definitive guide for developers on how to move past the ambiguity. We’ll deconstruct the ‘clean label’ concept into its core programmatic components, demonstrate how to mathematically score it, and provide the technical framework to integrate this powerful data into your application. You started by looking for how to add allergen detection; you’re about to learn how to add trust detection.


    Food Scan Genius App Scanner

    Clean Label Definition: What Consumers and Regulators Mean

    At its core, ‘clean label’ is a consumer-driven movement that represents a desire for transparency and simplicity in food products. When a consumer looks for a ‘clean label,’ they are looking for a product they can trust, and that trust is built on a few key perceptions:

    1. Short, Simple Ingredient List: They expect to see a handful of ingredients, not a paragraph.
    2. Recognizable Ingredients: They want to read ingredients they could find in their own kitchen, like ‘flour,’ ‘sugar,’ and ‘butter,’ not ‘calcium propionate’ or ‘potassium bromate.’
    3. Minimal Processing: They perceive the food as being closer to its natural state.

    For consumers, it’s an intuitive sniff test. For developers, this intuition is a nightmare. There’s no single, universally accepted definition. The FDA in the United States, for example, has no formal definition for ‘clean label,’ though it does regulate related terms like ‘organic’ and has guidelines for ‘natural.’

    This lack of a clear regulatory framework creates a massive data challenge. How do you programmatically determine if an ingredient is ‘recognizable’? How do you quantify ‘minimal processing’? Without a standard, building a feature around this concept feels like building on sand.

    This is where a structured data approach becomes essential. To translate the fuzzy consumer concept of ‘clean label’ into a reliable, scalable feature, you must break it down into quantifiable attributes. Instead of trying to define ‘clean’ as a monolithic boolean, we must model it as a composite score derived from multiple, verifiable data points. It requires moving from a simple keyword match to a sophisticated, weighted analysis of a product’s entire ingredient profile and production process. This is the only way to deliver a consistent, defensible, and valuable ‘clean label’ feature to your users.


    The 5 Categories of Clean Label Attributes

    To build a robust programmatic model for clean label, we must first dissect the concept into distinct, analyzable categories. At NutriGraph, our data science team has identified five core pillars that form the foundation of our clean label scoring algorithm. By evaluating a product against these five vectors, we can transform the abstract idea of ‘clean’ into a concrete, numerical score.

    1. No Artificial Additives

    This is perhaps the most fundamental aspect of the clean label movement. It refers to the absence of synthetic substances used to add color, flavor, or texture. Consumers are increasingly wary of ingredients that sound like they were created in a lab.

    • Technical Challenge: Maintaining a comprehensive, constantly updated database of thousands of artificial additives, colorings (e.g., FD&C Red No. 40), and flavor enhancers (e.g., monosodium glutamate – MSG). This isn’t a simple string search; it requires parsing complex ingredient statements, handling variations in naming conventions, and understanding the context in which an ingredient is used.
    • Examples of ‘Unclean’ Ingredients: Aspartame, Sucralose, Sodium Nitrite, Artificial Flavors, Blue 1, Yellow 5.
    ScanGeni Ventures Logo

    2. No Preservatives

    Preservatives are substances added to food to prevent spoilage and extend shelf life. While functional, many consumers view them as unnatural additions. This category targets synthetic preservatives specifically.

    • Technical Challenge: Differentiating between natural preservatives (like salt, sugar, or vinegar) and artificial or chemical preservatives (like BHA, BHT, or sorbic acid). A simple check for the word ‘preservative’ is insufficient. The system must be intelligent enough to identify specific chemical compounds and classify them correctly.
    • Examples of ‘Unclean’ Ingredients: Butylated Hydroxyanisole (BHA), Butylated Hydroxytoluene (BHT), Tertiary Butylhydroquinone (TBHQ), Sodium Benzoate.

    3. Non-GMO

    Genetically Modified Organisms (GMOs) are a major concern for a significant segment of the clean label audience. A product’s clean label status is heavily impacted by whether its ingredients are derived from genetically engineered crops.

    • Technical Challenge: This cannot be determined from the ingredient list alone. It requires access to external datasets and certifications, such as the USDA Organic seal or the Non-GMO Project Verified label. The API needs to ingest and normalize data from these disparate certification bodies, linking them accurately to specific UPCs.
    • Data Signal: Presence of official certifications (e.g., is_non_gmo_project_verified).

    4. Organic

    Organic certification is a strong, government-regulated indicator of clean label principles. It inherently covers non-GMO and prohibits the use of most synthetic pesticides and fertilizers.

    • Technical Challenge: Similar to Non-GMO, this relies on certification data. The system must be able to parse different levels of organic certification (e.g., ‘100% Organic,’ ‘Organic,’ ‘Made with Organic Ingredients’) and weight them appropriately in the final score. The absence of a seal is as important as its presence.
    • Data Signal: Presence and type of organic certification (e.g., is_usda_organic).

    5. Minimal Processing

    This is the most complex attribute to quantify. It refers to the idea that the food has undergone few changes from its natural state. Highly processed foods, even if they contain no artificial additives, are generally not considered ‘clean.’

    • Technical Challenge: Scoring this requires a sophisticated heuristic model. The model must analyze the form of the ingredients (e.g., ‘whole wheat flour’ vs. ‘enriched bleached flour’), identify processes implied by the ingredient list (e.g., ‘hydrogenated,’ ‘hydrolyzed’), and consider the overall product category. A bag of frozen broccoli is minimally processed; a cheese-flavored extruded corn puff is not. This requires a deep, semantic understanding of food science, not just ingredient matching.
    • Examples of Highly Processed Indicators: High Fructose Corn Syrup, Hydrogenated Oils, Maltodextrin, Hydrolyzed Soy Protein.

    By breaking down ‘clean label’ into these five measurable components, we can move from subjective opinion to objective data, creating a foundation for a powerful and reliable application feature.


    How Clean Label is Scored Programmatically (NutriGraphAPI’s Clean Label Score + Transparency Index)

    Once we have the five pillars, the next challenge is to synthesize them into a single, intuitive metric that developers can use and end-users can understand. At NutriGraph, we solved this by creating a proprietary, dual-index system: the clean_label_score and the transparency_index.

    This isn’t just about presence or absence; it’s a weighted algorithm. Simply checking for a ‘bad’ ingredient isn’t enough. The presence of one artificial color in a long list of otherwise natural ingredients should be scored differently than a product composed almost entirely of synthetic compounds.

    Our system works by first performing a deep analysis of a product’s ingredient statement, certifications, and other metadata. Each of the five pillars is evaluated and assigned a sub-score.

    1. Additive & Preservative Analysis: Our engine parses the ingredient string and cross-references it against a database of over 5,000 artificial additives, preservatives, and chemicals of concern. Each match decrements the score, with certain ‘high-impact’ additives assigned a heavier penalty.
    2. Certification Check: The system queries for linked USDA Organic and Non-GMO Project certifications. The presence of these certifications provides a significant boost to the score.
    3. Processing Heuristics: Our algorithm analyzes ingredient names for indicators of heavy processing (e.g., ‘hydrolyzed’, ‘autolyzed’, ‘mechanically separated’). It also considers the ingredient’s position in the list and the overall product category to assess the degree of processing.

    These sub-scores are then fed into a weighted formula to produce the final clean_label_score, an integer from 0 to 100.

    • A score of 0-40 indicates a highly processed product with numerous artificial ingredients.
    • A score of 41-70 represents a conventional product that may have some undesirable ingredients but is not overtly artificial.
    • A score of 71-90 signifies a good product, largely free of artificial additives and preservatives.
    • A score of 91-100 is reserved for exemplary products, typically certified organic, non-GMO, and containing only whole, recognizable ingredients.

    But a score is only half the story. We also provide a transparency_index. This secondary score, also 0-100, measures the quality and completeness of the data available for the product. A product might be very clean, but if the manufacturer provides a vague ingredient list or lacks certifications, the transparency index will be lower. This allows developers to distinguish between a product that is known to be clean and one that is presumed to be clean due to a lack of data. For your application, this is crucial. You can choose to display scores only above a certain transparency threshold, ensuring the data you show your users is always reliable.

    This two-score system provides the nuance necessary to build a truly intelligent feature, giving you both the what (clean_label_score) and the why (transparency_index).


    What a 95/100 Clean Label Score Actually Means

    A high score is more than just a number; it’s the result of a comprehensive data analysis that validates a product’s quality. When your application receives a score of 95 from the NutriGraph API, it signifies that the product has met a rigorous set of criteria.

    A 95/100 score typically means:

    • Certified Organic: The product almost certainly carries the USDA Organic seal.
    • Certified Non-GMO: It is verified as free from genetically modified ingredients.
    • No Artificial Ingredients: Our parser found zero matches for artificial colors, flavors, sweeteners, or other synthetic additives.
    • No Chemical Preservatives: The ingredient list is free from compounds like BHA, BHT, and sodium benzoate.
    • Simple, Recognizable Ingredients: The ingredient list is short and consists of whole food items (e.g., ‘organic rolled oats,’ ‘organic apples,’ ‘cinnamon’).

    Let’s look at a raw JSON response for a hypothetical organic oat bar that would receive such a score. This is the kind of structured data payload your backend would receive from a NutriGraph API call.

    {
      "upc": "0123456789012",
      "product_name": "Organic Apple Cinnamon Oat Bar",
      "brand": "Simple Harvest",
      "ingredients_text": "Organic Rolled Oats, Organic Date Paste, Organic Apples, Organic Sunflower Oil, Organic Cinnamon, Sea Salt.",
      "analysed_data": {
        "clean_label": {
          "score": 95,
          "transparency_index": 98,
          "grade": "A+",
          "analysis": {
            "has_artificial_additives": false,
            "has_artificial_preservatives": false,
            "processing_level": "MINIMALLY_PROCESSED",
            "additives_found": [],
            "preservatives_found": []
          }
        },
        "certifications": {
          "is_usda_organic": true,
          "is_non_gmo_project_verified": true
        }
      }
    }
    

    Let’s break down the analysed_data block:

    • score: 95: The final, aggregated score. This is the primary metric you’d use to display a rating, sort lists, or filter results.
    • transparency_index: 98: This indicates we have high confidence in the source data. The ingredient list is complete, and certifications are confirmed.
    • grade: "A+": A simple letter grade, useful for UI elements where a number might be too granular.
    • analysis block: This is where you get the ‘why’ behind the score. You can see boolean flags like has_artificial_additives: false which could be used to display checkmarks or icons in your app’s UI.
    • processing_level: "MINIMALLY_PROCESSED": Our heuristic model’s output, giving you a clear category for the product’s processing.
    • additives_found: []: An empty array, confirming no red-flag ingredients were detected. If any were found, their names would be listed here, allowing you to provide even more detail to curious users.
    • certifications block: This provides the verifiable data points (is_usda_organic: true) that heavily contributed to the high score.

    This structured JSON payload gives you everything you need. You have the top-level score for simple display and the detailed, granular data to build a rich, informative, and trustworthy user interface.


    How to Filter Products by Clean Label Status in Your App

    Having access to a clean label score for individual products is powerful, but the real magic happens when you can use this data to drive discovery and search within your application. You want to empower users to find all products that meet their standard of ‘clean.’

    The NutriGraph API is designed for this. You can use our /products/search endpoint and pass in parameters to filter results based on the clean_label_score.

    Imagine a user wants to find snack bars that are exceptionally clean. You can translate that user intent into a direct API query. The clean_label_score_min parameter allows you to set a minimum threshold for the results returned.

    Here is a cURL example of how to query for all products in the ‘Snack Bars’ category (category ID 25) with a clean_label_score of 90 or higher.

    curl -X GET 'https://api.nutrigraphapi.com/v2/products/search?query=bar&category_id=25&clean_label_score_min=90&page=1&limit=20' \
    -H 'x-api-key: YOUR_API_KEY'
    

    Let’s break down this query:

    • https://api.nutrigraphapi.com/v2/products/search: The endpoint for searching and filtering products.
    • query=bar: A simple text search to narrow down results to bars.
    • category_id=25: Filters the search to a specific product category, in this case, ‘Snack Bars’. This ensures you don’t get granola bars mixed with soap bars.
    • clean_label_score_min=90: This is the key parameter. It instructs the API to only return products that have a calculated clean label score of 90 or greater.
    • page=1&limit=20: Standard pagination parameters to control the response size.
    • -H 'x-api-key: YOUR_API_KEY': Your unique authentication token.

    The API response will be a JSON array of product objects, each one guaranteed to have a clean_label.score of 90 or above. This allows you to build powerful features with minimal front-end logic:

    • A ‘Clean Eating’ filter toggle: Let users instantly hide all products below a certain score.
    • Tiered search results: Display products with a 90+ score first, followed by 80+, and so on.
    • Curated collections: Create dynamic collections like ‘Top 10 Cleanest Yogurts’ or ‘Best Clean Label Pantry Staples’ that automatically update as new product data becomes available.

    By leveraging server-side filtering, you reduce the data processing load on your client applications and create a faster, more responsive user experience.


    Clean Label vs. Organic vs. Natural: The Differences Developers Need to Know

    In the world of food data, precision is everything. To a consumer, the terms ‘clean label,’ ‘organic,’ and ‘natural’ might seem interchangeable. For a developer building a data-driven application, they are distinct concepts with specific, and sometimes legally binding, definitions. Understanding these differences is crucial for building an accurate and trustworthy platform.

    Organic

    • Definition: This is a highly regulated term. In the U.S., the USDA National Organic Program (NOP) defines strict standards for any product bearing the ‘USDA Organic’ seal. These standards govern everything from soil quality and pest control to animal raising practices.
    • Key Attributes: Prohibits most synthetic fertilizers and pesticides, no antibiotics or growth hormones for livestock, non-GMO.
    • Programmatic Signal: It’s a boolean. A product either is or is not certified organic. This is a verifiable data point, usually found in a field like is_usda_organic.
    • Relationship to Clean Label: Being certified organic is a very strong positive signal for a high clean label score. It automatically satisfies the non-GMO criteria and prohibits many artificial additives and preservatives. However, an organic product can still be highly processed (e.g., organic high fructose corn syrup), so ‘organic’ does not automatically equal a perfect 100/100 clean label score.

    Natural

    • Definition: This is the most ambiguous and often misleading term. The FDA has a long-standing but informal policy that ‘natural’ means nothing artificial or synthetic (including all color additives regardless of source) has been included in, or has been added to, a food that would not normally be expected to be in that food.
    • Key Attributes: Vague. Generally implies no artificial colors, flavors, or sweeteners.
    • Programmatic Signal: Very weak. There is no official, verifiable certification for ‘natural.’ A manufacturer can put it on the label with very little oversight. In your database, you might have a is_natural flag, but it should be treated with low confidence.
    • Relationship to Clean Label: The concept of ‘natural’ is a subset of the ‘clean label’ idea, but it’s an unreliable one. Our clean label score does not give significant weight to a ‘natural’ claim on its own. Instead, we analyze the ingredient list to see if the product actually lives up to the claim.

    Clean Label

    • Definition: As we’ve established, this is a consumer-driven concept, not a regulated one. It is a holistic assessment of a product’s simplicity, transparency, and lack of undesirable ingredients.
    • Key Attributes: Encompasses the best aspects of ‘organic’ (non-GMO, no synthetic pesticides) and ‘natural’ (no artificial additives) but adds an additional layer of analysis regarding the degree of processing and the overall simplicity of the ingredient list.
    • Programmatic Signal: A composite score, like NutriGraph’s clean_label_score. It is not a simple boolean but a calculated metric derived from multiple data points.

    Here’s the hierarchy for a developer:

    1. Organic: A strong, verifiable, and legally defined attribute. Trust this data.
    2. Clean Label Score: A powerful, synthesized metric that models consumer intent. It’s more holistic than ‘organic’ because it accounts for processing.
    3. Natural: A weak, largely unenforceable marketing claim. Use this flag with caution, if at all.

    By modeling your data to respect these distinctions, you can provide your users with clear, accurate, and nuanced information that helps them make truly informed decisions, cementing your app as an authoritative resource.


    It’s clear that consumer demand for transparency isn’t a fleeting trend; it’s a fundamental shift in the marketplace. Providing basic allergen and nutrition data is no longer enough. The winning applications will be those that can successfully translate the complex, emotional concept of ‘clean food’ into a simple, reliable, and actionable digital experience. This requires moving beyond basic data and embracing a more sophisticated, analytical approach.

    We’ve designed NutriGraphAPI to be the engine that powers this next generation of health and wellness applications. We handle the complexity of parsing ingredient lists, verifying certifications, and scoring products so you can focus on what you do best: building an incredible user experience.

    Stop trying to build a ‘clean label’ function on ambiguous data. Start building it on a foundation of clarity.

    Explore NutriGraphAPI’s clean label schema and test the 1,000-call Sandbox.

  • How to Choose a Food API for Your Meal Planning App (What Data You Actually Need)

    How to Choose a Food API for Your Meal Planning App (What Data You Actually Need)

    There are over 1.7 million apps on the App Store. A significant number of them are trying to solve the same problem: ‘What’s for dinner?’ Most of them will fail.

    They won’t fail because of a bad UI or a slow backend. They’ll fail because of a crisis of confidence. A user gets a ‘vegan’ recipe with honey. A user with a gluten intolerance gets a recommendation for something made with barley. A parent trying to feed their family healthier food is recommended a meal that’s technically low-calorie but is ultra-processed junk.

    Trust, once broken, is gone forever. And in the health-tech space, trust is your only currency.

    If you’re a CTO, a lead developer, or a founder scoping the architecture for your meal planning application, you’re at a critical juncture. The food API you choose right now will define the ceiling of your product’s potential. It will dictate whether you build a simple calorie counter or a trusted, indispensable health platform.

    You already know you need macronutrients—calories, protein, fat, carbs. That’s table stakes. It’s what the other 99 apps are doing. But the market isn’t won by meeting expectations; it’s won by anticipating the needs your users haven’t even articulated yet. It’s about seeing the future and building for it now.

    This isn’t just a guide to choosing a food API. This is a blueprint for building a product that lasts. Let’s talk about the data you actually need.


    What Data a Meal Planning App Actually Needs (Beyond Basic Macros)

    Every food API, including basic ones like Spoonacular, can give you the ‘big four’: calories, protein, carbohydrates, and fats. This is the nutritional equivalent of knowing a car’s color and number of doors. It’s descriptive, but it tells you nothing about the quality of the engine, the safety rating, or the fuel efficiency.

    To build a platform that genuinely improves health outcomes, you must go deeper. Your data layer is the foundation of your user’s trust.

    Food Scan Genius App Scanner

    The Foundational Layer: Advanced Macronutrient Data

    Beyond a simple total, your users need a breakdown. It’s not just ‘fat,’ it’s:

    • Saturated Fat: Critical for heart health metrics.
    • Polyunsaturated Fat: Important for brain function.
    • Monounsaturated Fat: Key in diets like the Mediterranean diet.
    • Trans Fat: A hard ‘avoid’ for any health-conscious user.

    It’s not just ‘carbohydrates,’ it’s:

    • Dietary Fiber: Essential for digestive health.
    • Sugars (Total and Added): The distinction between sugars in an apple and added high-fructose corn syrup is one of the most important metrics for modern health.
    • Net Carbs: Non-negotiable for any app targeting the massive Keto and low-carb market.

    The Next Level: Micronutrients and Glycemic Data

    This is where you graduate from a calorie counter to a nutrition tool. Micronutrients are the vitamins and minerals that govern everything from energy levels to immune response. A user trying to manage anemia needs to track iron. Someone focused on bone density needs calcium and Vitamin D. Your API must provide comprehensive micronutrient profiles, including:

    • Vitamins: A, C, D, E, K, and the B-complex vitamins (B1, B2, B3, B5, B6, B7, B9, B12).
    • Minerals: Calcium, Iron, Magnesium, Potassium, Sodium, Zinc, and more.

    Furthermore, for a huge segment of the population managing diabetes, pre-diabetes, or simply their energy levels, Glycemic Index (GI) and Glycemic Load (GL) are more important than calorie counts. These metrics measure how quickly a food raises blood sugar levels. Recommending a ‘low-calorie’ meal with a high GI can be actively harmful to these users. An intelligent API provides this data per ingredient and per recipe.

    The Strategic Differentiator: Ingredient-Level Provenance

    Where does the data come from? A generic entry for ‘apple’ is useless. Is it a Red Delicious or a Granny Smith? Is it organic? Is the data from a verified government database like the USDA’s FoodData Central, or is it user-submitted and prone to error? A premium API provides source-level attribution for its data, allowing you to build a product on a foundation of verifiable truth.


    ScanGeni Ventures Logo

    Dietary Restriction Handling: Vegan, Keto, Paleo, Low-FODMAP, and What the API Needs to Return

    Handling dietary restrictions is the first major test of your data’s integrity. A simple boolean flag isVegan: true is an invitation to disaster. These are not simple tags; they are complex, rule-based systems of inclusion and exclusion.

    Your user doesn’t care about your boolean flags. They care about the fact that you just recommended a ‘vegan’ soup that was thickened with gelatin or a ‘keto’ snack bar sweetened with maltitol, which can spike blood sugar.

    An enterprise-grade food API doesn’t just return a label. It returns the reasoning. Here’s what your API response needs to contain for a few of the most common, and complex, diets:

    • Vegan/Vegetarian: It’s not just ‘no meat’. A robust check includes flagging hidden animal products like casein, whey, gelatin, honey, carmine, and certain forms of Vitamin D3. The API should be able to distinguish between ovo-lacto vegetarian, lacto-vegetarian, and strict vegan.

    • Keto/Low-Carb: This requires precise calculation of Net Carbs (Total Carbs – Fiber – certain sugar alcohols). The API needs to have a sophisticated understanding of different sweeteners and their metabolic impact. A simple total carb count is a recipe for kicking your users out of ketosis.

    • Paleo: This is more than low-carb. It requires the exclusion of entire food groups: grains, legumes, dairy, refined sugars, and processed oils. Your API needs a deep ingredient ontology to correctly identify and flag a product containing, for example, soybean oil or wheat flour.

    • Low-FODMAP: This is arguably one of the most complex therapeutic diets, crucial for users with IBS. It involves excluding specific types of fermentable carbs (Fermentable Oligosaccharides, Disaccharides, Monosaccharides, and Polyols). This is impossible to manage without a database that has analyzed ingredients at a chemical level. Your API needs to identify high-FODMAP ingredients like garlic, onions, high-fructose corn syrup, and lactose with pinpoint accuracy.

    For each of these, your API shouldn’t just return a pass/fail. It should provide a compatibility object, detailing which ingredients pass, which fail, and why. This allows you to build a user experience that educates, not just dictates.


    Allergen Exclusion: Why “Contains Peanuts” Isn’t Enough

    When you handle food allergies, you are operating in a domain with zero tolerance for error. The legal and moral liability is immense. The phrase “contains peanuts” is the bare minimum, the elementary school version of allergen data.

    A professional health platform needs to account for the nuances that can mean the life or death of its users.

    Cross-Contamination Warnings

    The most significant gap in basic food APIs is the lack of data on cross-contamination. A product can be free of peanut ingredients but manufactured on the same equipment as peanut butter. For someone with a severe allergy, this is a distinction that matters. Your API must parse and return explicit manufacturer warnings like:

    • "Processed in a facility that also handles tree nuts."
    • "May contain traces of wheat and soy."

    Without this, you are exposing your users to unacceptable risk and your company to significant liability.

    Ingredient Derivatives

    Allergens are masters of disguise. A user allergic to soy needs to avoid not just tofu, but also soy lecithin. A user with a corn allergy needs to be wary of xanthan gum, which is often derived from corn. A dairy allergy extends to whey, casein, and lactose.

    Your API needs a sophisticated ingredient graph that understands these relationships. It must be able to flag a product containing ‘soy lecithin’ when a user specifies a ‘soy’ allergy. A simple string match on an ingredient list is dangerously inadequate.

    The ‘Big 9’ and Beyond

    The FDA requires labeling for the nine major allergens (sesame was added in 2023). But a global app needs a global perspective. What about mustard in Canada or lupin in Europe? A truly capable API provides configurable allergen profiles based on region and goes far beyond the basics to include common intolerances like gluten, sulfites, and more.


    Quality Scoring for Meal Recommendations: Nutri-Score, NOVA, Health Star Rating

    Your users don’t just want meals that fit their macros. They want better meals. They want to make healthier choices. How do you, as an app developer, quantify ‘healthy’?

    This is where objective, science-backed quality scores become a powerful tool for product differentiation. Instead of making your users guess, you can show them a simple, color-coded rating. This transforms your app from a data log into a decision engine.

    Leading food APIs integrate these global standards:

    • Nutri-Score: Widely adopted in Europe, this front-of-pack label grades food from ‘A’ (best) to ‘E’ (worst) based on a scientific formula that balances positive nutrients (fiber, protein) against negative ones (sugar, sodium, saturated fat). It provides an at-a-glance quality assessment.

    • NOVA Classification: This system from Brazil is becoming the global standard for classifying food by its level of processing. It has four categories:

      1. NOVA 1: Unprocessed or minimally processed foods (e.g., fresh fruit, eggs).
      2. NOVA 2: Processed culinary ingredients (e.g., olive oil, butter).
      3. NOVA 3: Processed foods (e.g., canned vegetables, simple bread).
      4. NOVA 4: Ultra-processed foods (e.g., soda, packaged snacks, most ready-to-eat meals).
        Research increasingly links high consumption of NOVA 4 foods to poor health outcomes. Providing this score empowers your users to reduce their intake of ultra-processed products, a goal that goes far beyond simple calorie counting.
    • Health Star Rating: Used in Australia and New Zealand, this system rates products from 0.5 to 5 stars, providing another simple visual cue for healthier choices.

    Integrating these scores allows you to build features like ‘Suggest a healthier swap’ or ‘Show me only NOVA 1-3 meals’. This is a level of sophistication that commodity APIs like Spoonacular simply can’t offer. You’re no longer just providing recipes; you’re providing nutritional guidance.


    Religious Dietary Compliance: Halal, Kosher, Jain, Hindu – The Overlooked Requirement

    For billions of people, food choices are guided by deeply held religious and cultural beliefs. For these users, a meal planning app that ignores their needs isn’t just unhelpful; it’s disrespectful. This is a massively underserved market, and the technical partner you choose will determine if you can even enter it.

    Handling this requires far more than flagging ‘pork’.

    • Halal: It’s not just about avoiding pork and alcohol. It extends to the method of slaughter (Zabihah) and the complete absence of contamination from non-Halal substances. This requires data from certified Halal products, not just ingredient guesswork.

    • Kosher: Like Halal, this involves a complex set of laws regarding which foods can be consumed and how they must be prepared. It requires identifying certifications from recognized bodies (e.g., OU, OK, KOF-K) and understanding rules like the separation of meat and dairy.

    • Jain: This vegetarian diet has even stricter rules, excluding root vegetables (like onions and garlic) and other ingredients that involve harming the entire plant.

    • Hindu: While many Hindus are vegetarian, many are not but will still abstain from beef. An app must be able to accommodate this specific exclusion.

    To service these users, your API can’t rely on inference. It needs a database that explicitly tracks certifications and has a data model capable of representing these complex rules. When you can confidently serve a user searching for ‘Certified Halal, gluten-free, low-carb meal ideas,’ you are operating in a different league from your competitors. You’re not just building an app; you’re building a tool for inclusive, global wellness.


    How NutriGraphAPI Covers All of This in a Single API Call

    We’ve just outlined a staggering level of data complexity. The traditional approach would be to stitch together multiple services: one API for basic nutrition, another for allergen data (if you can find it), a scraped database for dietary rules, and a team of nutritionists to manually curate and verify everything.

    The engineering overhead, cost, and data inconsistency of that approach will kill your product before it ever finds product-market fit.

    This is the problem NutriGraph was built to solve. We believe that world-class data should be an accelerant, not an obstacle. We’ve done the painstaking work of aggregating, verifying, and structuring this data so you can focus on what you do best: building an incredible user experience.

    With NutriGraph, you can retrieve a complete, multi-faceted nutritional profile for any food item or recipe in a single, elegantly structured API call. One request gives you:

    • Comprehensive Macro & Micro-Nutrient Profiles: From net carbs to Vitamin K, with data sourced from verified government and manufacturer databases.
    • Deep Dietary Analysis: Not just a boolean, but a detailed breakdown for Vegan, Keto, Paleo, Low-FODMAP, and dozens of other diets.
    • Certified Allergen & Intolerance Data: Including cross-contamination warnings and derivative ingredient mapping.
    • Objective Quality Scores: Nutri-Score, NOVA classification, and Health Star Rating are returned as standard fields.
    • Verifiable Religious Compliance: Data on Halal and Kosher certifications from trusted authorities.

    Stop thinking about how to integrate a half-dozen mediocre data sources. Start thinking about the powerful, personalized, and trustworthy features you can build on a foundation of a single, definitive source of truth.


    Sample Response Walkthrough

    Talk is cheap. Let’s look at the data. Here is a sample JSON response from a NutriGraph API query for a single product. Notice how every concern we’ve discussed—from micronutrients to NOVA scores to Halal certification—is present, structured, and ready to use.

    {
      "id": "ng_8a2b4e7c1f0d",
      "productName": "Organic Chickpea & Spinach Curry",
      "servingSize": {
        "value": 250,
        "unit": "g"
      },
      "nutritionFacts": {
        "calories": 320,
        "macronutrients": {
          "protein": {"value": 14, "unit": "g"},
          "fat": {
            "total": {"value": 12, "unit": "g"},
            "saturated": {"value": 3, "unit": "g"},
            "polyunsaturated": {"value": 4, "unit": "g"},
            "monounsaturated": {"value": 5, "unit": "g"},
            "trans": {"value": 0, "unit": "g"}
          },
          "carbohydrates": {
            "total": {"value": 38, "unit": "g"},
            "fiber": {"value": 10, "unit": "g"},
            "sugars": {"value": 6, "unit": "g"},
            "addedSugars": {"value": 2, "unit": "g"},
            "netCarbs": 28
          }
        },
        "micronutrients": [
          {"name": "Iron", "amount": {"value": 4, "unit": "mg"}, "percentDailyValue": 22},
          {"name": "Potassium", "amount": {"value": 650, "unit": "mg"}, "percentDailyValue": 15},
          {"name": "Vitamin C", "amount": {"value": 30, "unit": "mg"}, "percentDailyValue": 33}
        ],
        "glycemicIndex": 35
      },
      "qualityScores": {
        "nutriScore": "A",
        "novaClassification": 3,
        "healthStarRating": 4.5
      },
      "dietaryCompliance": [
        {
          "diet": "Vegan",
          "isCompliant": true,
          "reasoning": "Contains no animal-derived ingredients. All components are plant-based."
        },
        {
          "diet": "Keto",
          "isCompliant": false,
          "reasoning": "Net carbs (28g) exceed typical ketogenic daily limits for a single serving."
        }
      ],
      "allergenInfo": {
        "contains": [],
        "warnings": [
          "Processed in a facility that also handles tree nuts and sesame."
        ],
        "freeFrom": ["Gluten", "Dairy", "Soy", "Peanuts"]
      },
      "religiousCompliance": {
        "halal": {
          "isCompliant": true,
          "certificationBody": "IFANCA",
          "status": "Certified"
        },
        "kosher": {
          "isCompliant": true,
          "certificationBody": "OU",
          "status": "Certified Pareve"
        }
      },
      "dataSource": "USDA FoodData Central, Manufacturer Direct"
    }
    

    This is what a foundation for trust looks like. It’s clean, comprehensive, and built for the serious developer.


    Your meal planning app has the potential to be a trusted partner in your users’ health journey. But that trust depends entirely on the quality of the data you feed it. Don’t build your future on a foundation of incomplete, unreliable, or superficial information.

    Choose the API that was built for the complexities of modern nutrition and global audiences. Choose the data layer that will scale with your ambition.

    Explore the schema at nutrigraphapi.com/docs and pull a 1,000-call developer key. See for yourself what a real food API can do.”,
    “json_ld_faq_schema”:
    },
    {
    “@type”: “Question”,
    “name”: “What is the technical difference between a food quality score like Nutri-Score and a simple calorie count?”,
    “acceptedAnswer”: {
    “@type”: “Answer”,
    “text”: “A calorie count is a single, raw data point. A quality score like Nutri-Score is a calculated, composite metric based on a scientific algorithm. The Nutri-Score formula algorithmically weighs ‘negative’ components (energy, saturated fats, sugars, sodium) against ‘positive’ components (fiber, protein, percentage of fruits/vegetables/nuts). The API performs this calculation on the backend, returning a simple A-E grade. This provides contextual insight into the overall healthfulness of a food, which a calorie count alone cannot do.”
    }
    },
    {
    “@type”: “Question”,
    “name”: “How can an API endpoint filter recipes by multiple, complex dietary needs like ‘Vegan’ and ‘Low-FODMAP’ simultaneously?”,
    “acceptedAnswer”: {
    “@type”: “Answer”,
    “text”: “An effective API allows for complex filtering through query parameters. For example, a request might look like GET /recipes?diet=vegan&diet=low_fodmap. On the backend, the system must have pre-computed or be able to compute in real-time the compliance of each recipe against both rule sets. This requires a robust data model where each ingredient is tagged with its properties (e.g., FODMAP level, animal-derived status). The API then filters the recipe database, returning only recipes where all ingredients satisfy the constraints of both specified diets.”
    }
    },
    {
    “@type”: “Question”,
    “name”: “Does a food API need to provide sourcing information for Halal or Kosher certification?”,
    “acceptedAnswer”: {
    “@type”: “Answer”,
    “text”: “Yes, for a platform to be considered trustworthy by users following religious diets, simply stating ‘isHalal: true’ is insufficient. A professional-grade API must provide provenance for the claim. The JSON response should include fields specifying the certification body (e.g., OU for Kosher, IFANCA for Halal) and the status (e.g., Certified, Pareve). This data allows the application to display verifiable proof of compliance, building critical user trust that cannot be achieved with a simple, unsubstantiated flag.